Vancouver Market - Chronicling Investment and Development Activity in Metro Vancouver
  • Home
  • Listings & Sales
  • Land Assembly
    • Official Community Plans (OCPs)
      • City of Burnaby
      • City of North Vancouver
      • District of North Vancouver
      • City of Vancouver
      • District of West Vancouver
    • Transit Oriented Areas (TOA) Policy
      • City of Burnaby
      • City of New Westminster
      • City of Vancouver
      • Transit Oriented Areas: How New Zoning Policy Affects Landowners
  • About
  • Subscribe
Vancouver Market - Chronicling Investment and Development Activity in Metro Vancouver
Home
Listings & Sales
Land Assembly
    Official Community Plans (OCPs)
    City of Burnaby
    City of North Vancouver
    District of North Vancouver
    City of Vancouver
    District of West Vancouver
    Transit Oriented Areas (TOA) Policy
    City of Burnaby
    City of New Westminster
    City of Vancouver
    Transit Oriented Areas: How New Zoning Policy Affects Landowners
About
Subscribe
  • Home
  • Listings & Sales
  • Land Assembly
    • Official Community Plans (OCPs)
      • City of Burnaby
      • City of North Vancouver
      • District of North Vancouver
      • City of Vancouver
      • District of West Vancouver
    • Transit Oriented Areas (TOA) Policy
      • City of Burnaby
      • City of New Westminster
      • City of Vancouver
      • Transit Oriented Areas: How New Zoning Policy Affects Landowners
  • About
  • Subscribe
Apartment, Development, Market Research

Market Spotlight: Vancouver Housing Stats

The City of Vancouver will present their third annual Housing and Homelessness Strategy Report Card to council next week. The purpose of the annual report is to track progress of the City’s various initiatives under the Housing and Homelessness Strategy 2012-2021.

The report is an excellent source of some key housing indicators compiled from CMHC and REBGV, of which several are summarized here:

  • the City of Vancouver had 4,648 dwellings commence construction in 2014 (approximately 25% single family and 75% multi-family units). This rate is close to the 5-year annual average of 4,824.
  • Vacancy rates continued to decrease between 2013 and 2014, both in the city of
    Vancouver (from 1.0% to 0.5%) and regionally (from 1.7% to 1.0%) reflecting
    ongoing population growth and demand for housing
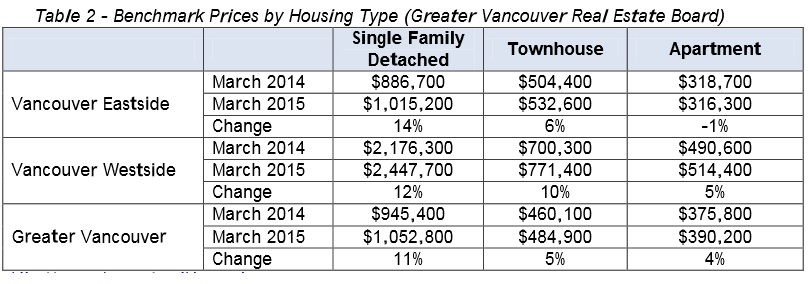
  • Between March 2014 and March 2015, the benchmark  price for a single family
    house increased by 14% on the eastside and 12% on the westside, while the
    benchmark price for condos fell by 1% on the eastside and increased by 5% on
    the westside.
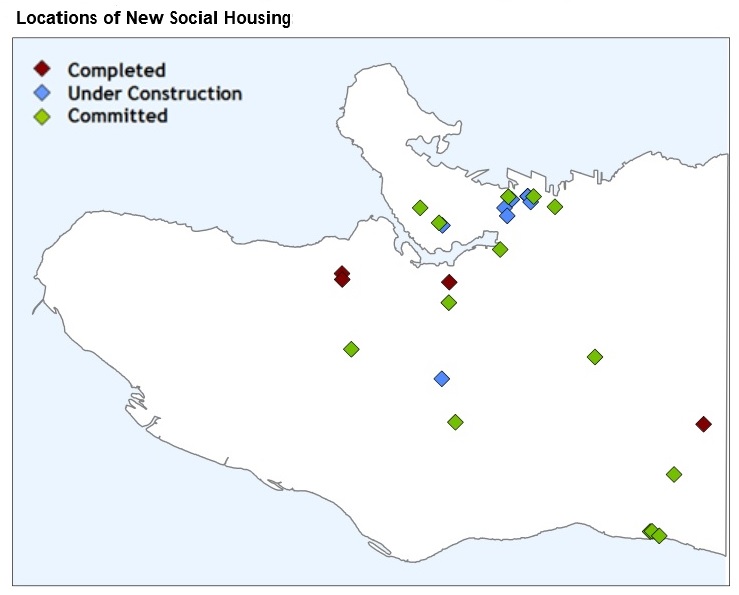
  • 409 units of interim supportive housing were created in 2014 (395 Kingsway, 3475 E. Hastings, 1335 Howe and 1060 Howe)
  • 439 units of permanent supportive housing were created (1134 Burrard, 111 Princess, 2465 Fraser and 951 Boundary)
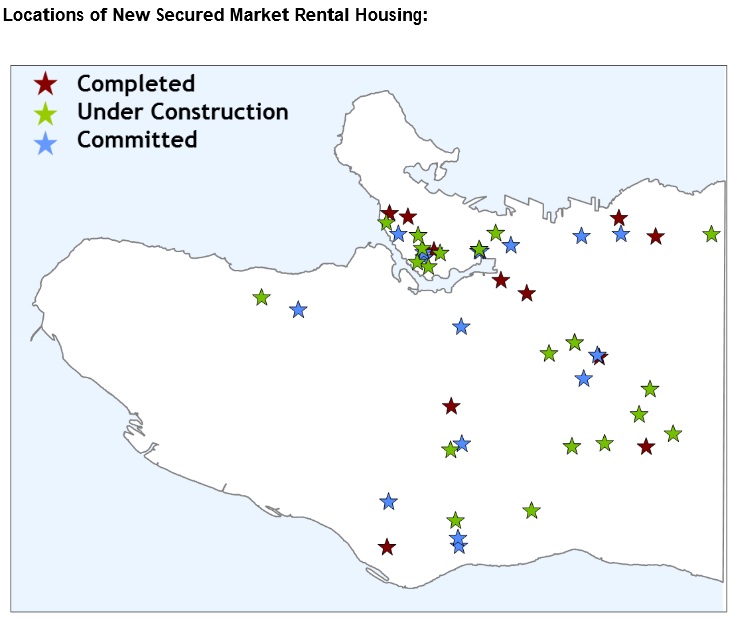
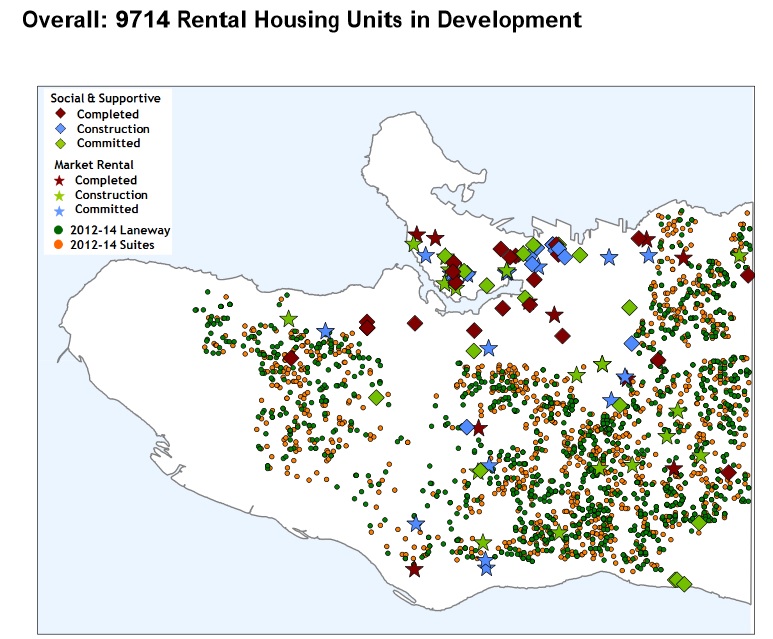
  • 3,783 secured market rental units have been approved during 2012-2014 (only 407 were actually completed in 2014)

CofV_Housing report_1 CofV_Housing report_2 CofV_Housing report_3

CofV_Housing report_4

May 22, 2015by david.taylor@colliers.com

Search the Site

Tweets by vancouvermrkt

Categories

  • Apartment
  • Condo
  • Development
  • For Sale
  • Hotel
  • Investment
  • Land
  • Market Research
  • Office
  • Rental
  • Retail


David Taylor Personal Real Estate Corporation

Colliers International

© 2019 Copyright  |  All Rights Reserved