Vancouver Market - Chronicling Investment and Development Activity in Metro Vancouver
  • Home
  • Listings & Sales
  • Land Assembly
    • Official Community Plans (OCPs)
      • City of Burnaby
      • City of North Vancouver
      • District of North Vancouver
      • City of Vancouver
      • District of West Vancouver
    • Transit Oriented Areas (TOA) Policy
      • City of Burnaby
      • City of New Westminster
      • City of Vancouver
      • Transit Oriented Areas: How New Zoning Policy Affects Landowners
  • About
  • Subscribe
Vancouver Market - Chronicling Investment and Development Activity in Metro Vancouver
Home
Listings & Sales
Land Assembly
    Official Community Plans (OCPs)
    City of Burnaby
    City of North Vancouver
    District of North Vancouver
    City of Vancouver
    District of West Vancouver
    Transit Oriented Areas (TOA) Policy
    City of Burnaby
    City of New Westminster
    City of Vancouver
    Transit Oriented Areas: How New Zoning Policy Affects Landowners
About
Subscribe
  • Home
  • Listings & Sales
  • Land Assembly
    • Official Community Plans (OCPs)
      • City of Burnaby
      • City of North Vancouver
      • District of North Vancouver
      • City of Vancouver
      • District of West Vancouver
    • Transit Oriented Areas (TOA) Policy
      • City of Burnaby
      • City of New Westminster
      • City of Vancouver
      • Transit Oriented Areas: How New Zoning Policy Affects Landowners
  • About
  • Subscribe
Market Research

Market Spotlight: Downtown Land Values…60 Years Ago

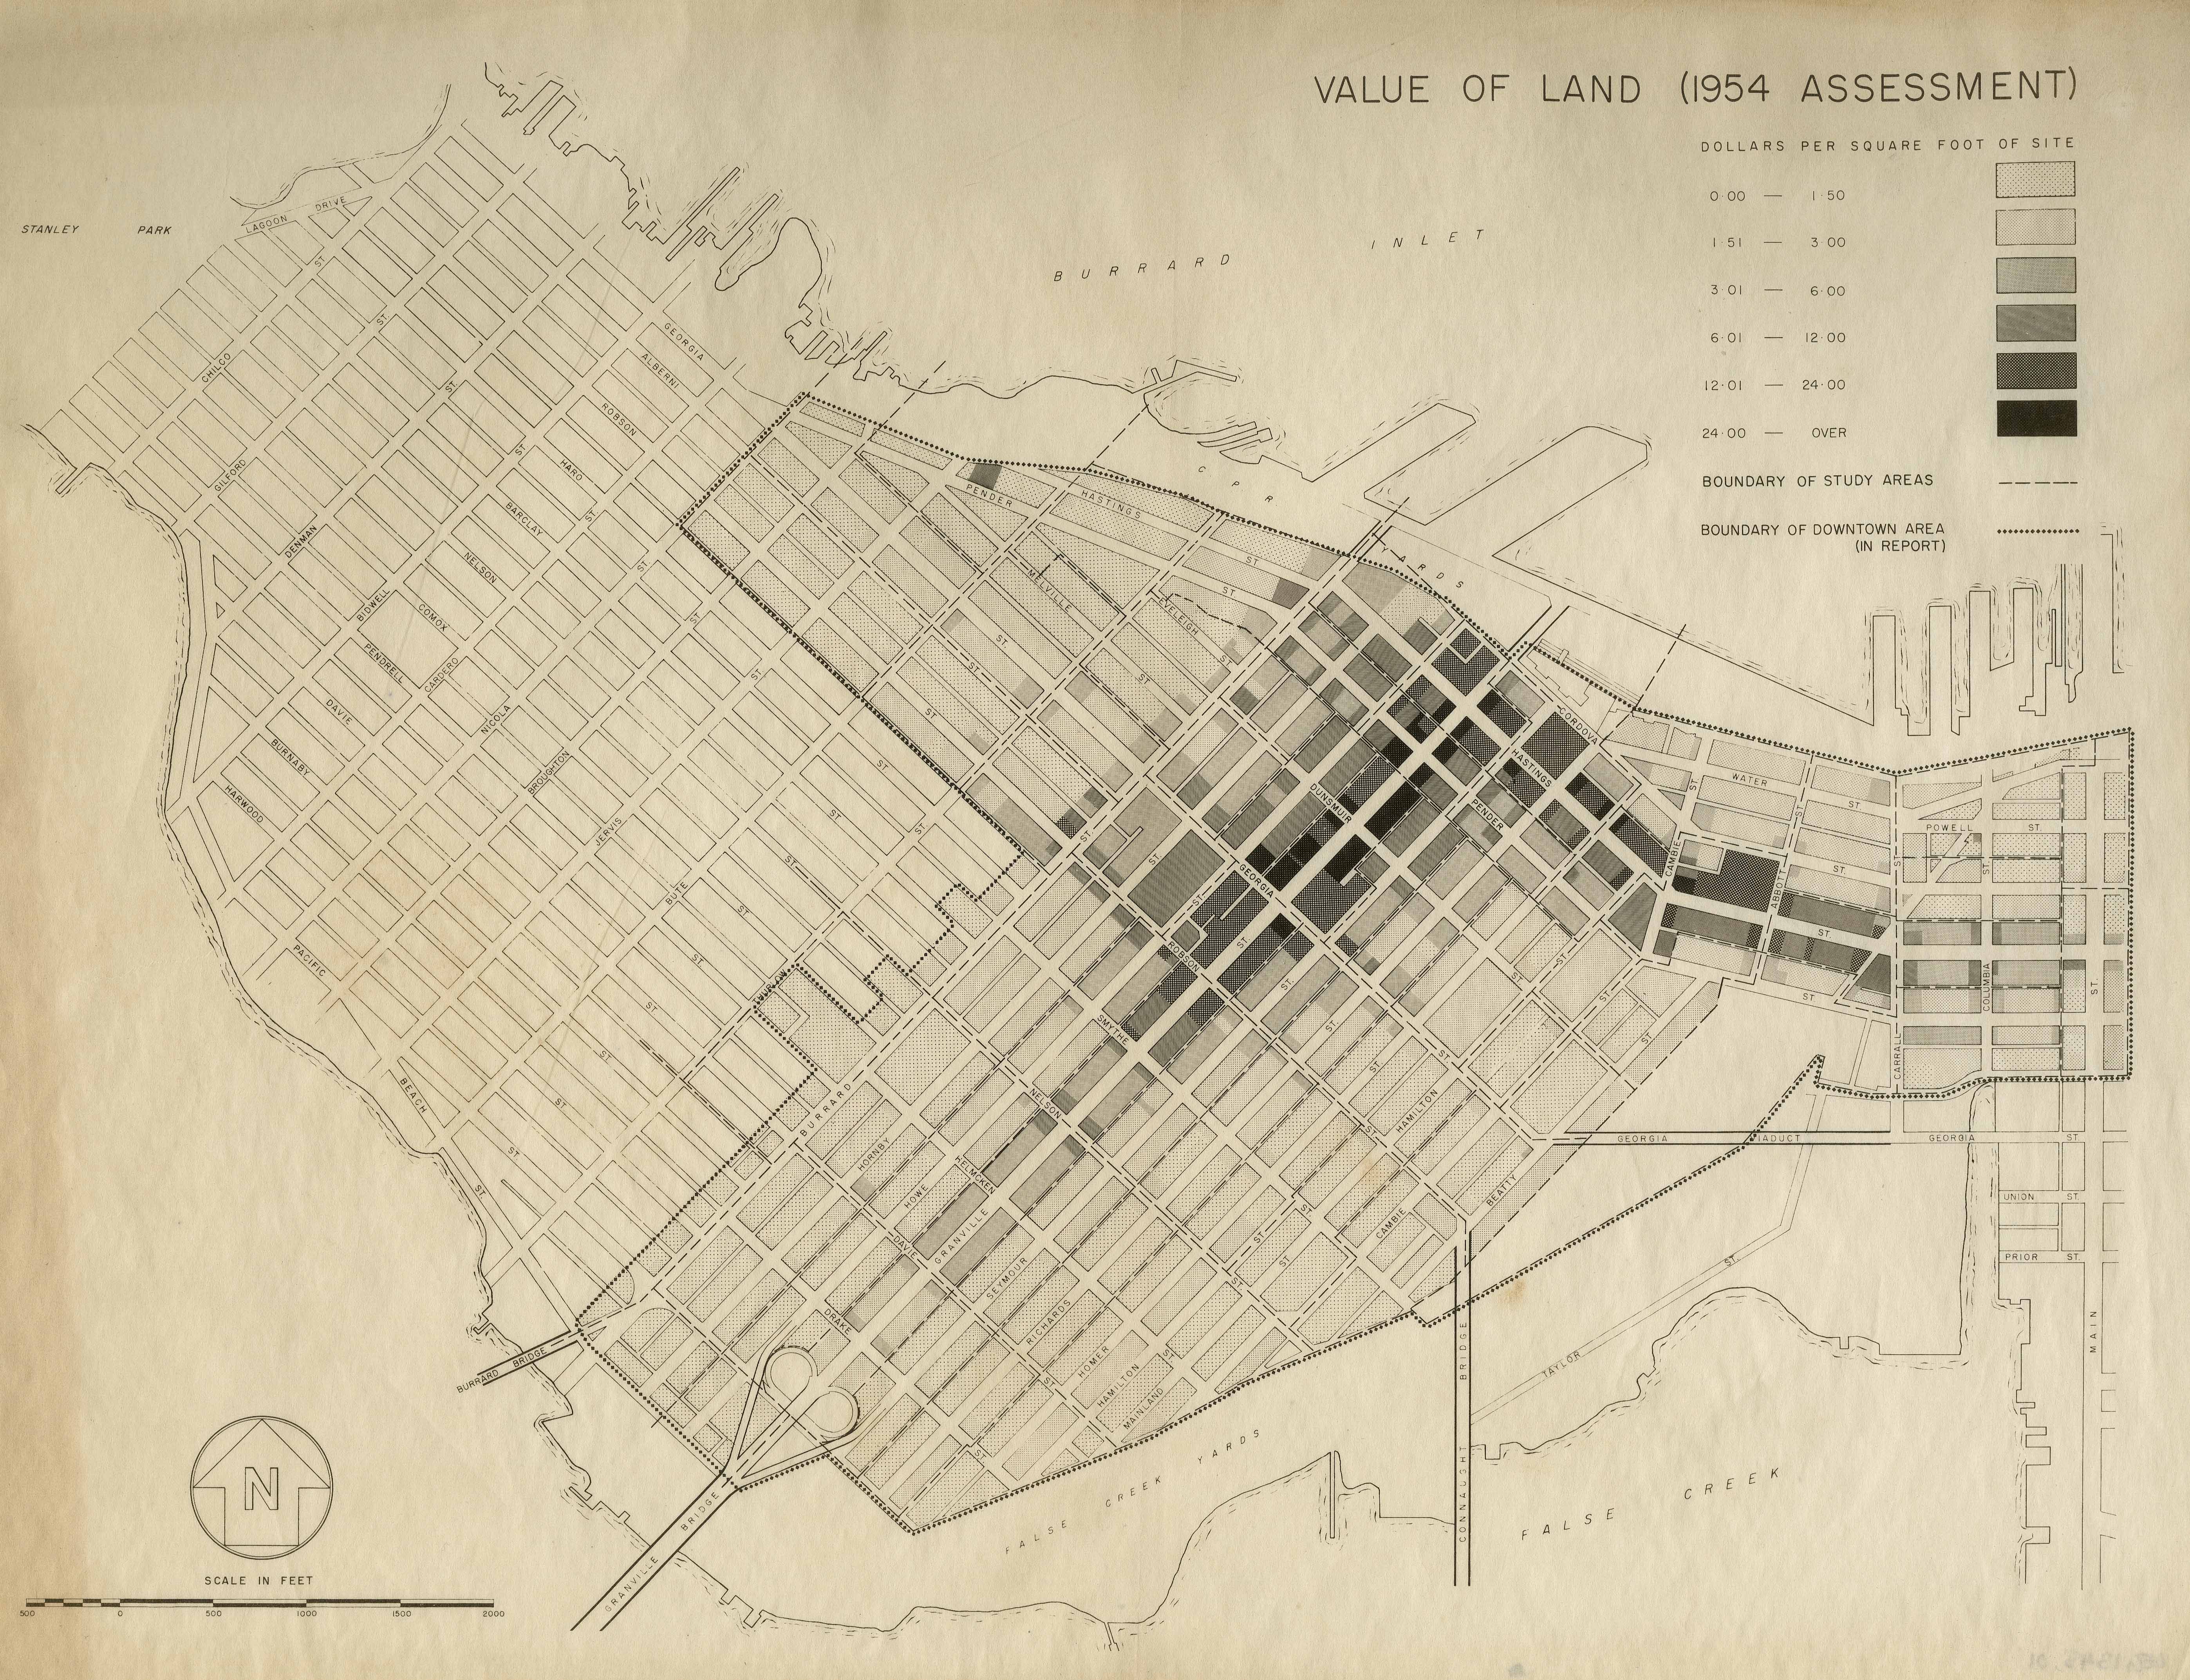
Here is an interesting map from 1956 from the City of Vancouver Archives showing land value assessments by $/SF from 1954 assessments in Downtown Vancouver.

Granville Street was the prime area back then at over $24.00 per SF of land! Conversely, Coal Harbour and Yaletown were steals at less than $1.50 per SF. Of course, these areas were still primarily industrial areas and condos were simply an idea that wouldn’t take hold for another decade. Fast forward sixty years and land values in those ‘hoods have increased approximately 2000%.

(click on the map for a zoomed in view)

Value of land (1954 assessment)
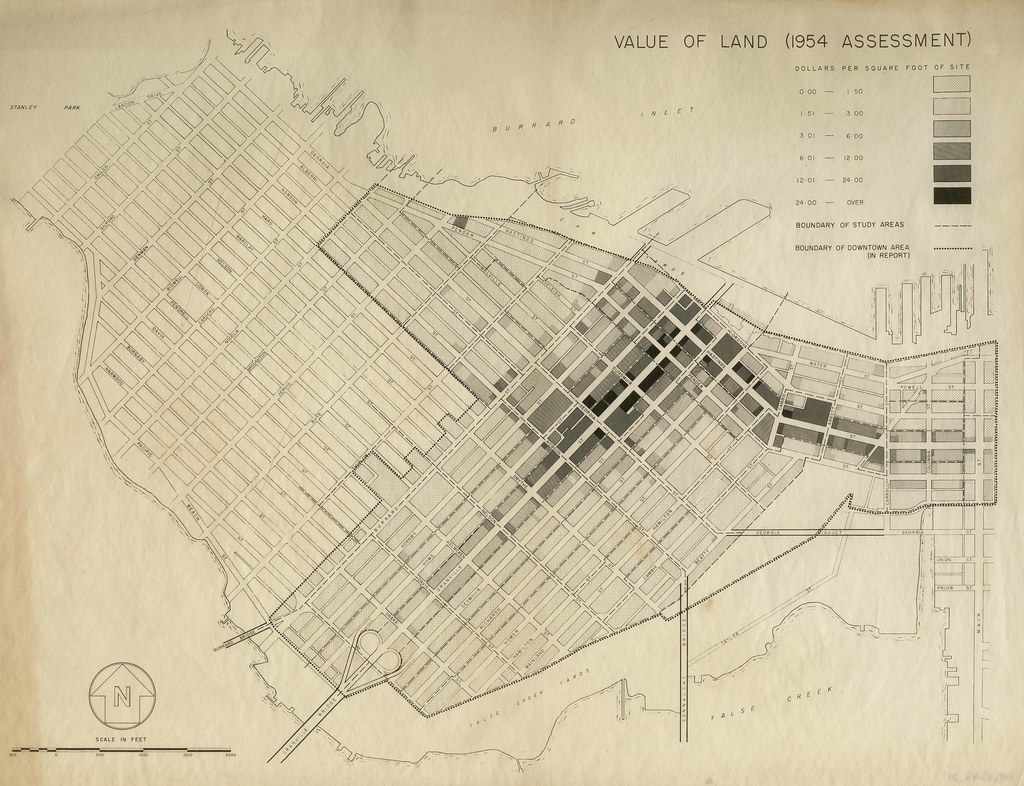
“Scope and content Item is a map showing land values in dollars per square foot for the downtown area bounded by Burrard Street, Robson Street, and Nicola Street in the west and Main Street in the east.”

April 1, 2016by david.taylor@colliers.com

Search the Site

Tweets by vancouvermrkt

Categories

  • Apartment
  • Condo
  • Development
  • For Sale
  • Hotel
  • Investment
  • Land
  • Market Research
  • Office
  • Rental
  • Retail


David Taylor Personal Real Estate Corporation

Colliers International

© 2019 Copyright  |  All Rights Reserved