Metro Vancouver Residential Market Pricing Data: August 2012
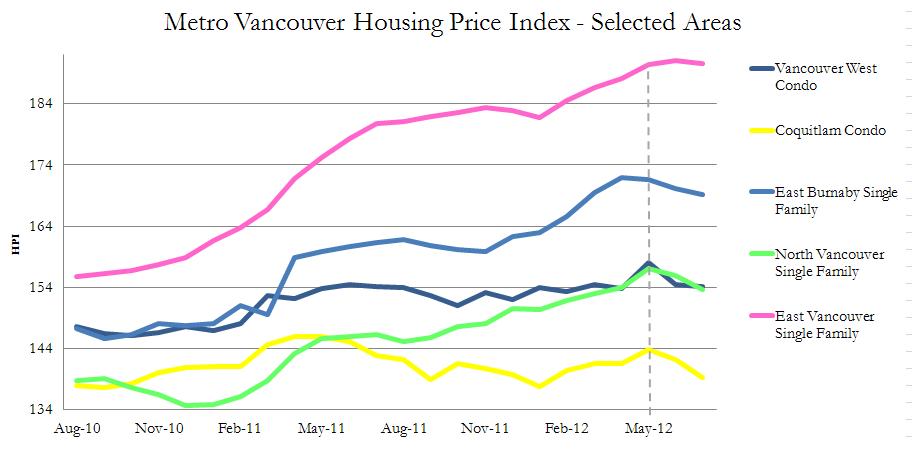
The Real Estate Board of Greater Vancouver has released data for July 2012 which shows that pricing is beginning to be negatively impacted by slowing sales. A selected grouping of housing types and areas, shown below, shows pricing changes over the last two years.
This comes as July was the slowest month for home sales in Metro Vancouver since 2000. Of course, prices are still up in most areas YoY, but there has been a consistent decline in June/July across all types and areas. Single family homes have shown the greatest run up in prices over the past two years.
(click above for greater detail)
The Home Price Index (HPI) measures local housing price changes similar to the consumer price index.
Source: REBGV stats