The Real Estate Board of Greater Vancouver have released August residential stats. Sales activity is up significantly over August 2012, while attendant price increases are modest at best. Here are a few highlights:
- Listings were down 8.8% from August 2012
- Sales were up 52.5% in August 2013 compared to August 2012.
- Single family benchmark pricing is up since January 2013 in almost all submarkets (except for secondary submarkets such as Sunshine Coast, Squamish and Bowen Island)
- Average prices are still down since August 2012 – for single family (-2.0%) and condos (-1.1%)
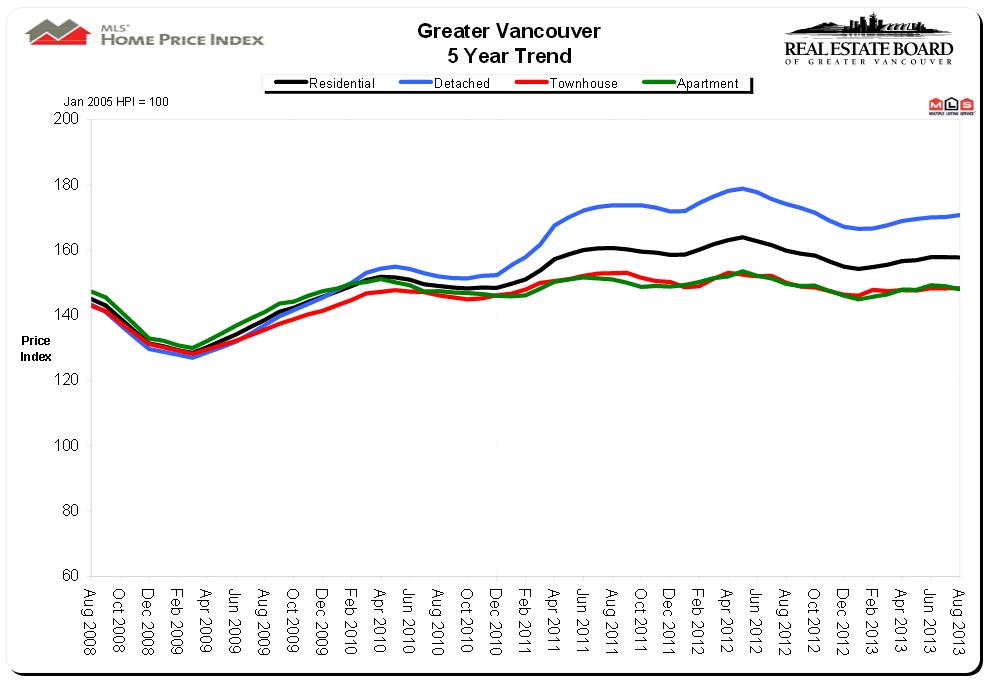
Source: REBGV stats