
Vancouver Market - Tracking commercial real estate investment sales across Metro Vancouver — sale prices, cap rates, and $/SF data for apartment, retail, office, land, and development transactions. By David Taylor, SVP at Colliers International Canada.
  • About
  • Listings & Sales
  • Thinking of Selling?
  • Metro Vancouver Commercial Real Estate Market Data
  • Subscribe
Market Research

Updated Grandview Woodlands Plan Unveiled

After initially launching the planning process for the Grandview Woodlands neighbourhood of East Vancouver in March 2012, the City of Vancouver has released what is expected to be the final draft of the plan that will go to Council for approval in the next few weeks.

The initial draft concept plan caused widespread opposition and resulted in the City pulling back by forming a Citizens’ Assembly and subsequently a two year process of community engagement.
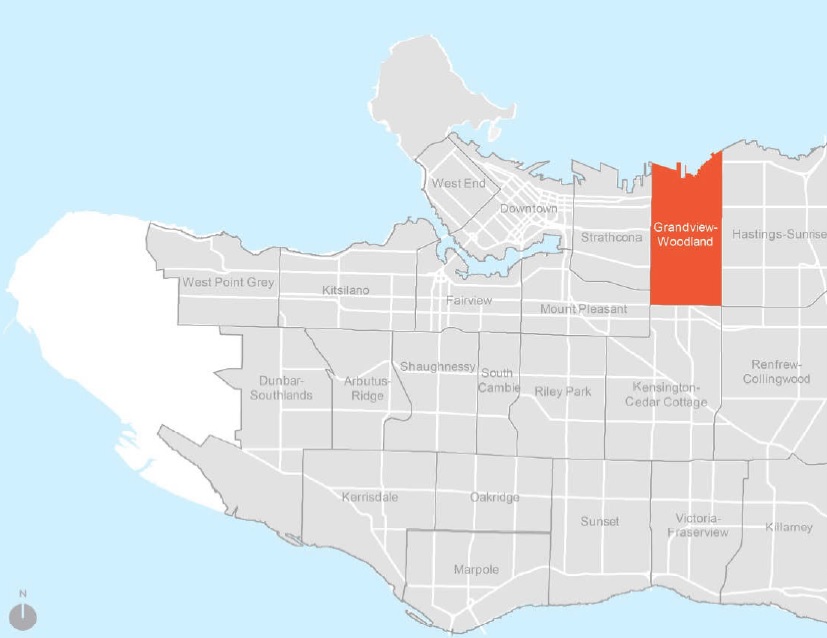
GW2

The resulting draft plan, which was released this weekend, contains few surprises, but generally lays out how the area is likely to be developed in the coming years in an area forecast to grow to 43,500 people by 2041.

Here is a sub-area breakdown for those unfamiliar:

“The Drive”
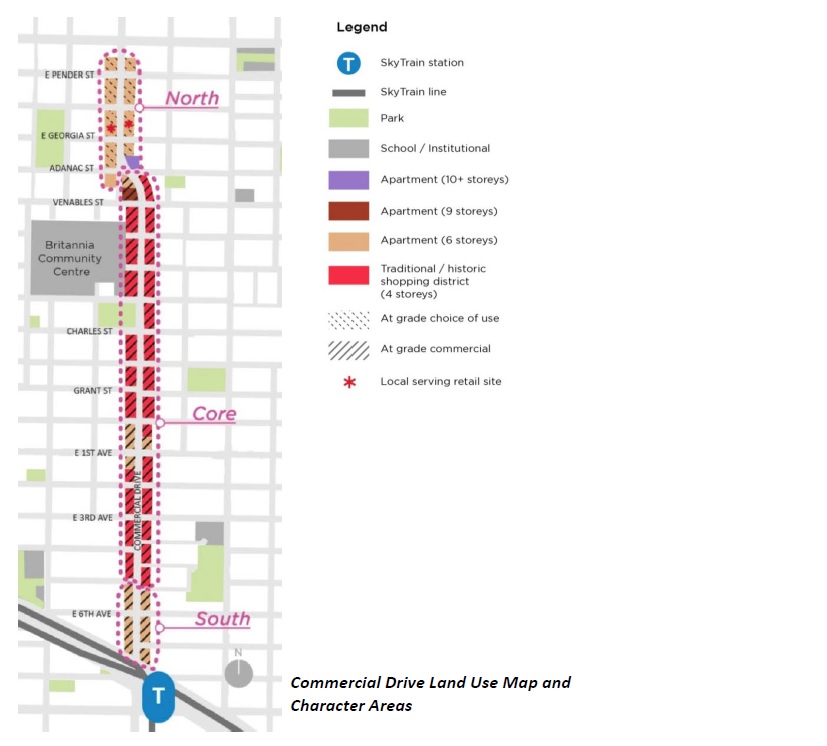
GW31. Retain the existing mixed‐use zoning (4-storeys or less) throughout the core blocks of Commercial Drive.
2. Maintain the pattern of smaller, individual retail frontages to help keep The Drive eclectic and active.
3. Outside of core and only on larger sites at the East 1st Avenue node, allow buildings up to 6-storeys/3.0 FSR to provide new housing.

Grandview
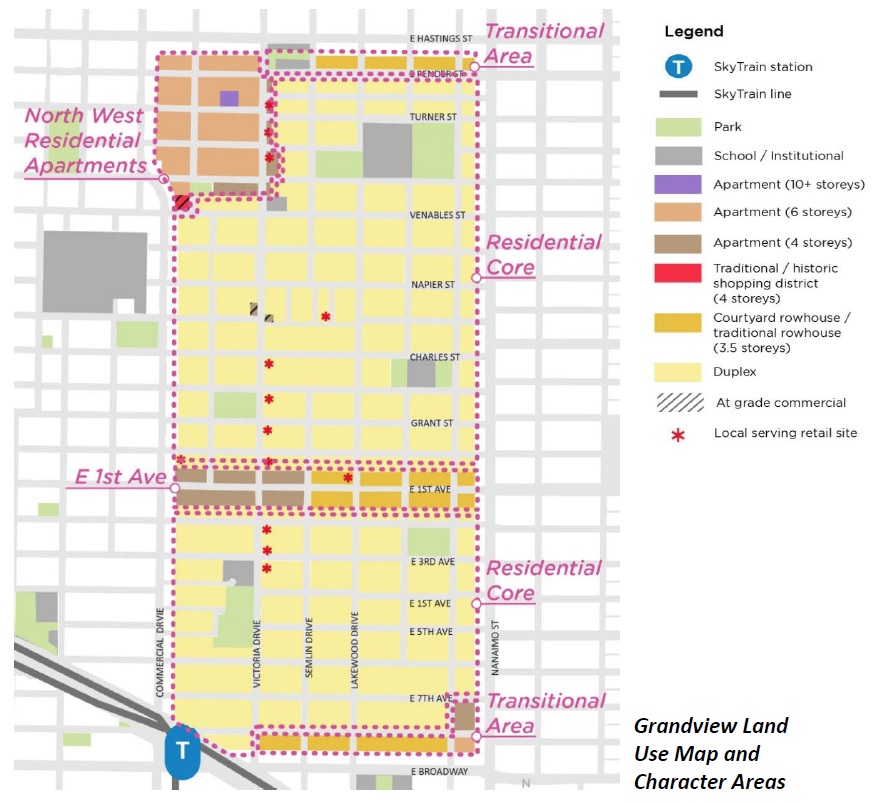
GW7

1. Modify regulations to discourage demolition of pre‐1940 houses.
2. Expand the duplex areas and revise regulations to encourage new infill housing.
3. Preserve the small‐scale local serving shops.
4. On arterial streets and in transition areas near transit routes on Hastings and on Broadway, allow a mix of four‐ storey apartments and rowhouses for families.
5. In the apartment district at the north end, allow buildings up to 6‐storeys / 2.4 FSR to provide renewed and additional secured rental housing while protecting character streetscapes.

HastingsGW4
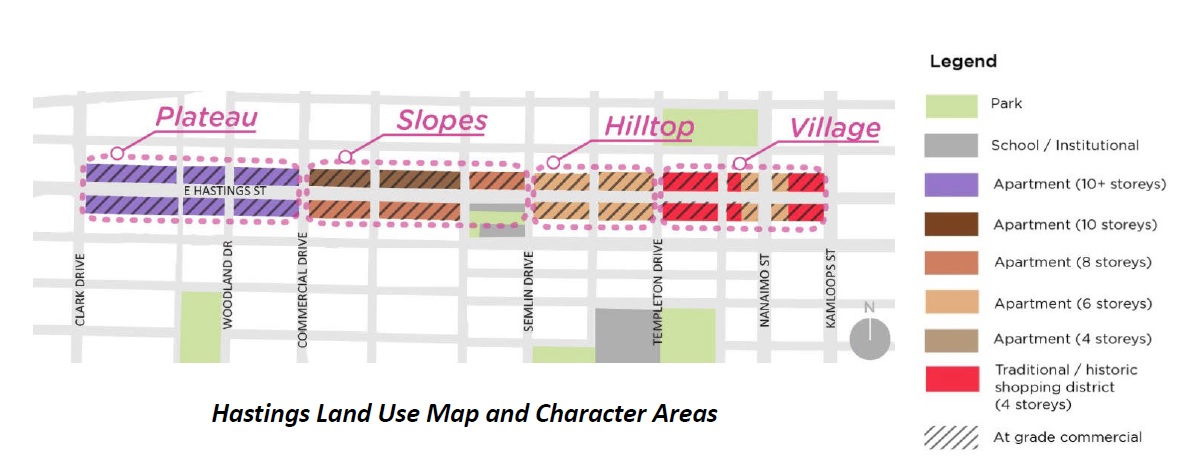
1. Create a new gateway area near Clark Drive that incorporates renewed cultural, social and heritage assets, along with non‐market and other housing, with the tallest buildings at 18‐storeys. Range of densities highest at 4.0 to 5.6 FSR.
2. Improve pedestrian comfort along Hastings Street with public plazas that will activate and unify the street.
3. Support renewal and expansion of key social facilities such as those provided by the Urban Native Youth Association and the Vancouver Aboriginal Friendship Centre.
4. Step buildings down to heights in the 8‐ to 10‐storey range (3.0 – 4.0 FSR) as one goes eastward up the hill towards Victoria Drive and provide new rental and ownership housing.
5. Retain the existing mixed‐use zoning (4-storeys or less) in the Hastings Village shopping area near Nanaimo Street.
6. Allow for 100% secured market rental housing in buildings up to 6-storeys in the central portions of Hastings Street.

Cedar CoveGW5
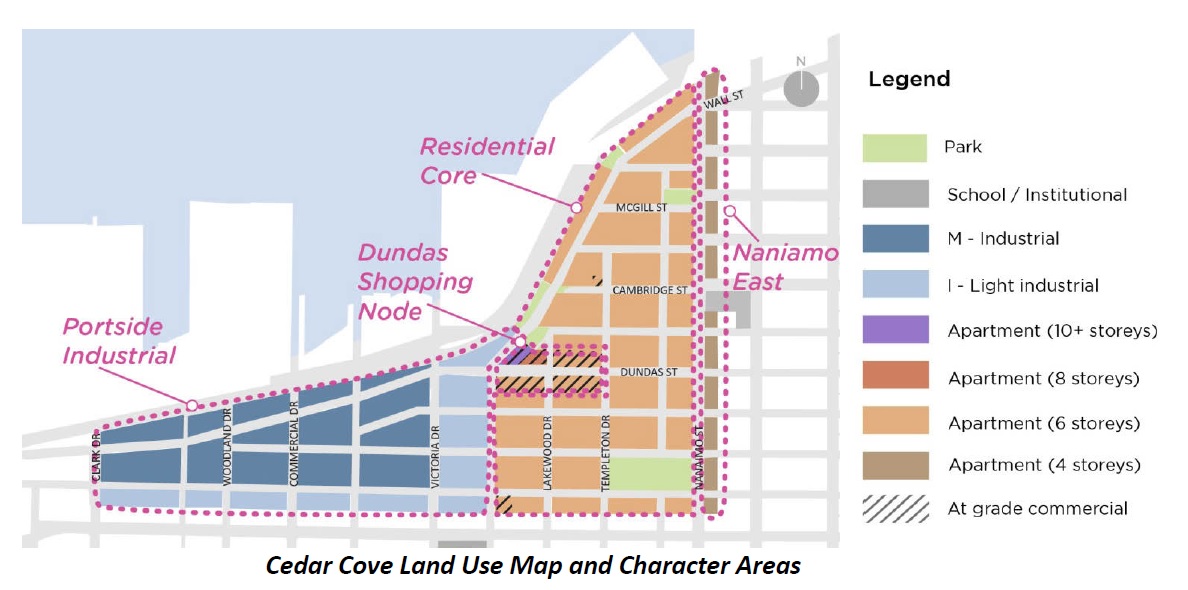
1. Maintain the existing protected rental housing stock while allowing for managed rental replacement and new supply in buildings up to 6-storeys (2.4 FSR) in the area west of Nanaimo Street and up to 4-storeys on the eastside of Nanaimo Street.
2. Expand the neighbourhood shopping node at Dundas and Wall to allow for more services closer to home.
3. Preserve the significant character streetscapes that have been identified.
4. To the north of the shopping node, encourage expansion of Oxford Park by allowing for mixed‐use buildings in the 8 to 12-storey range (3.2 FSR).
5. Protect the city’s industrial and port‐related jobs while improving the interface with residential areas.

Britannia WoodlandGW6
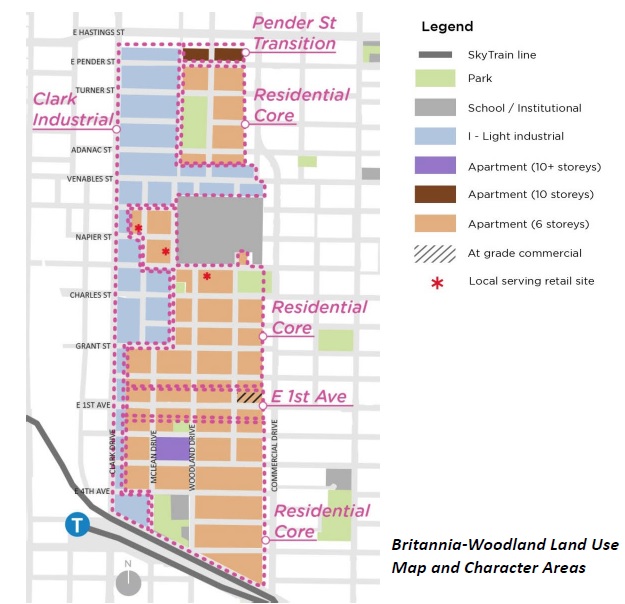
1. Maintain the existing protected rental housing stock while allowing for managed rental replacement and new supply in buildings up to 6-storeys / 2.4 FSR.
2. Preserve significant character streetscapes that have been identified and allow infill housing to encourage retention of older buildings.
3. On selected blocks on Pender Street, adjacent to the new gateway neighbourhood along Hastings Street, allow buildings up to 10-storeys / 3.2 FSR  to achieve new non‐market and other housing.
4. Retain space for local jobs and improve the interface between industrial and residential uses.

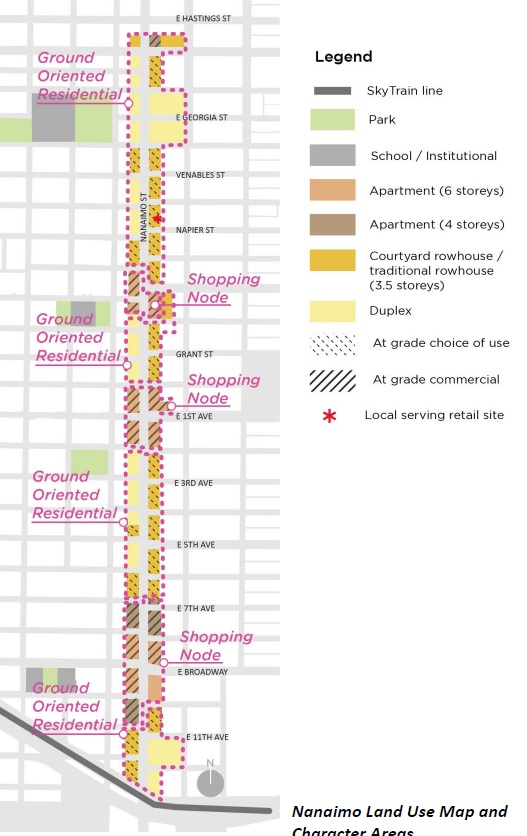
Nanaimo
GW8

1. Allow ground‐oriented housing, such as rowhouses suitable for families, along much of Nanaimo Street.
2. At commercial shopping nodes, allow mixed‐use buildings of between 4 and 6-storeys (2.0 – 3.0 FSR) to help bring new life to the local shopping nodes.
3. Improve pedestrian comfort in the public realm to activate and unify the street.

Commercial‐Broadway Station Precinct
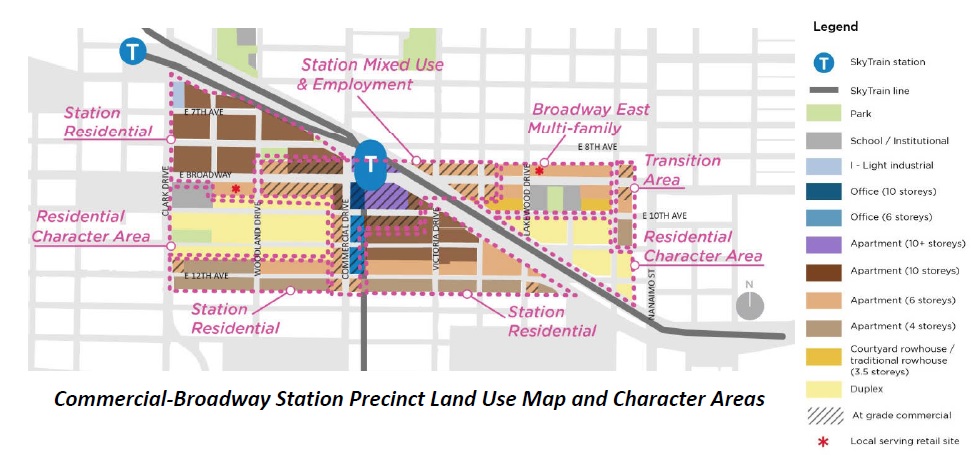
GW91. Create a new social heart for the community with a new civic plaza as part of a renewed Safeway site with ground‐floor commercial uses and new housing in buildings ranging from 12‐ to 24‐storeys (up to 5.7 FSR).
2. Near the station, allow mixed‐use and mixed‐tenure buildings ranging from 6 to 10-storeys.
3. In the Station Precinct residential areas, maintain the existing protected rental housing stock while allowing for managed rental replacement and new supply in 4 to 6‐storey buildings and 10‐storey buildings (4.0 FSR) on larger sites, provided that all new units are secured as rental housing.
4. Allow 6‐storey buildings on East Broadway and rowhouses in selected areas to provide family housing close to transit.
5. In the low‐scale, traditional character area located west and south of the transit station, allow duplex and two‐family dwellings with a focus on infill housing to retain character buildings.
6. Create new office space close to the rapid transit station.


How quickly the Grandview Woodlands plan area develops will be partially dependent upon market conditions but will also be shaped by the way in which the City of Vancouver will allow development to proceed per the Plan.

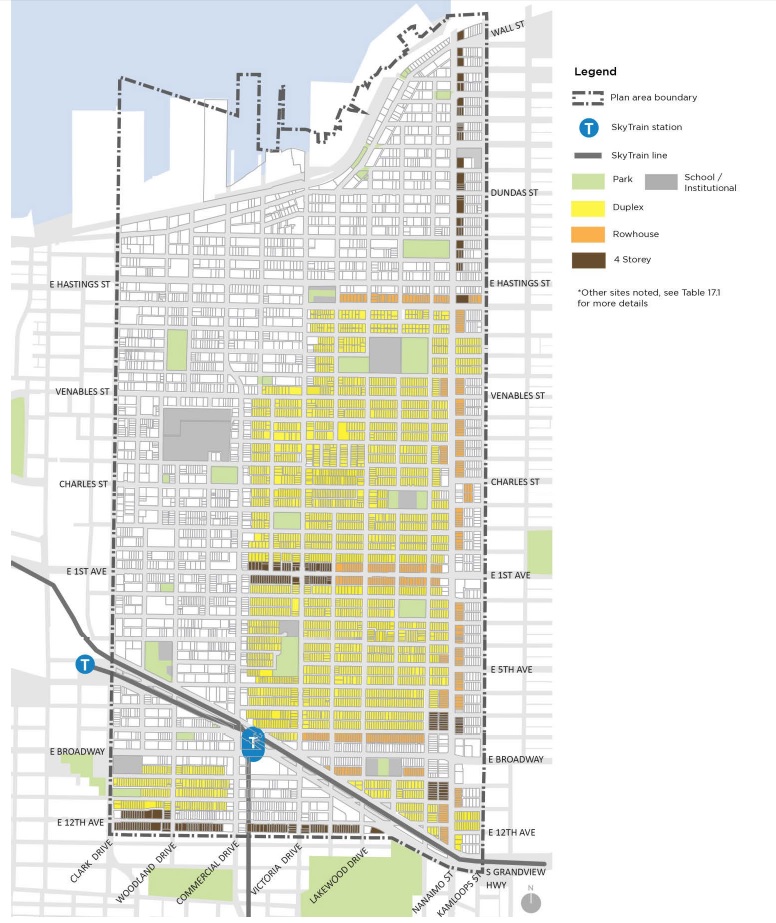
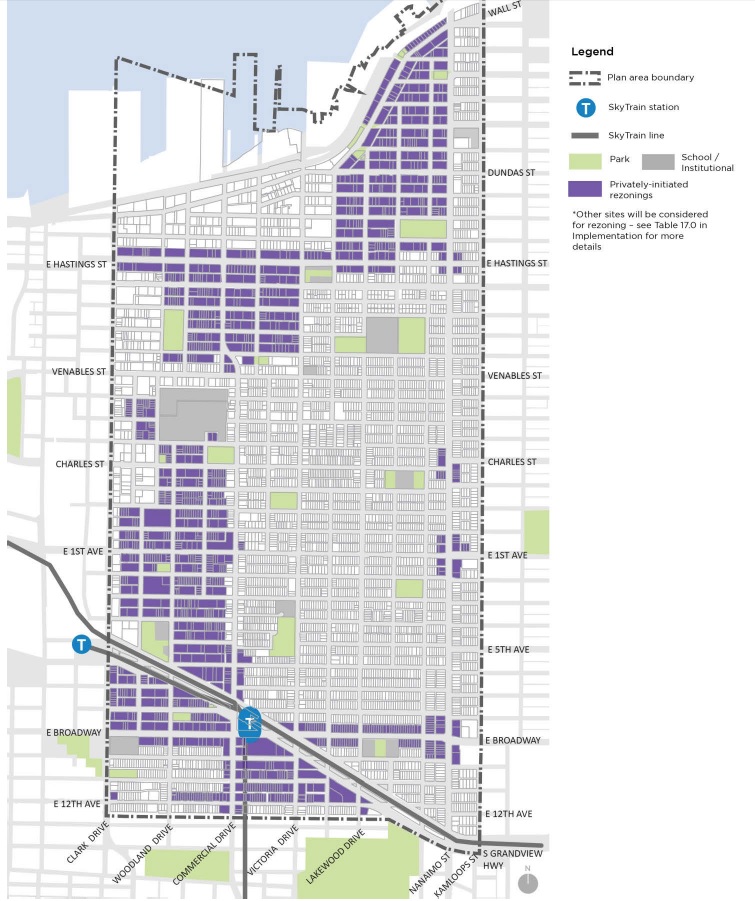
As was the case with both the Marpole Community Plan and the West End Community Plan, the Grandview Woodlands Community Plan divides the plan area into different sub-areas; effectively rezoning many areas and leaving others to be rezoned by proponents in the future. This ensures that larger scale projects will go through a typical rezoning process and smaller duplex and rowhouse projects will simply require development permits.

The proposed two areas are broken down as follows:

City-Initiated Rezoning Areas

These areas will be effectively “rezoned” and therefore will not require a lengthy application process and public hearing for each development.
GW12Privately Initiated Rezoning Areas

The map below depicts areas that will require a developer or building owner to apply for a rezoning and go through a typical rezoning process.
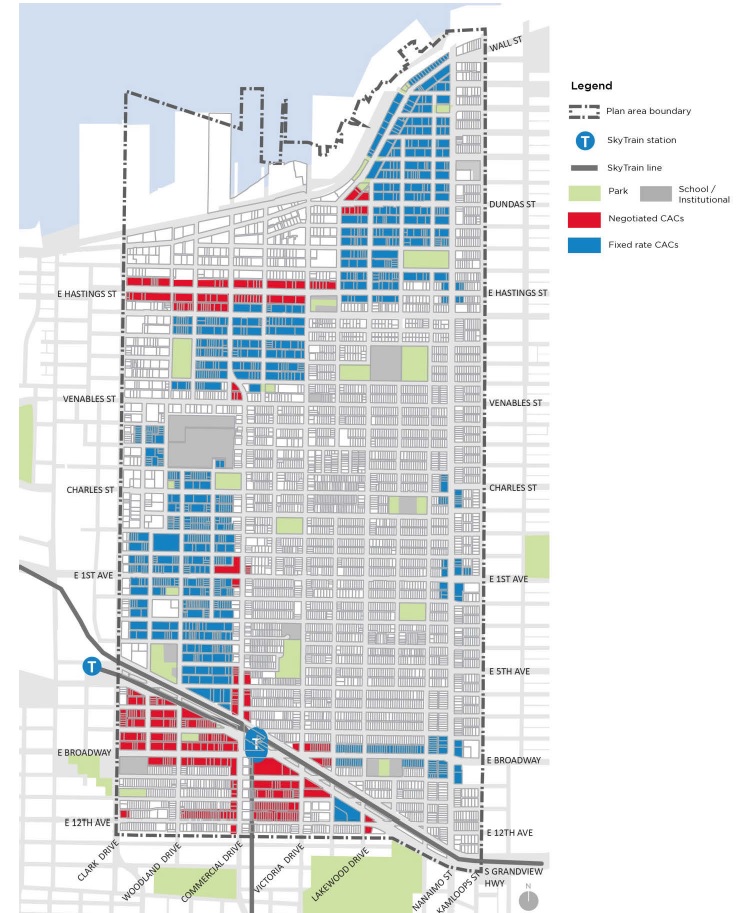
GW10Community Amenity Contributions (CACs)

Below is a map outlining where there will be a fixed-rate CAC target and where CACs will be negotiated on an application basis.
GW11A full copy of the draft Grandview Woodlands Community Plan can be downloaded at the City’s website: http://vancouver.ca/home-property-development/grandview-woodland-community-plan.aspx
June 27, 2016by david.taylor@colliers.com
Development, Market Research

City of Coquitlam to Expand CAC Program

The City of Coquitlam is likely to approve an expansion to their Community Amenity Contribution (CAC) program, as a result of several findings by City planning staff since late 2015 when they began exploring the idea of a policy regarding city-wide CACs.

Discussion topics from City staff included:

  • Impact on Housing Affordability – it was determined based on previous studies that a new Citywide CAC would not have significant impact on housing affordability
  • In-kind Contributions – this will be the standard approach at council’s discretion
  • Citywide CAC versus Area-specific CACs – City doesn’t want to have different target rates in different areas thereby creating an uneven playing field for development. CACs are intended to be used in each area.

The new fixed target CAC rates will be as follows:

  1. $3.00 per SF for the gross floor area of all new multifamily;
  2. $5,500 per parcel for all new one-family residential lots over 375 m2;
  3. $4,800 per parcel for all new one-family residential lots under 375 m2.

The new CAC program is set to take effect July 1, 2016, though project applications already in process will be exempt.

June 27, 2016by david.taylor@colliers.com
Development, Market Research

Change Coming for City of Vancouver’s CAC Policy

Next week, City of Vancouver council will review a policy report that recommends changes to the Community Amenity Contribution (CAC) policy as part of an ongoing initiative to streamline and simplify the City’s overall approach to development contributions.


The major recommendations on changes to the CAC policy include:


1. Adjusting CAC target rates annually for inflation
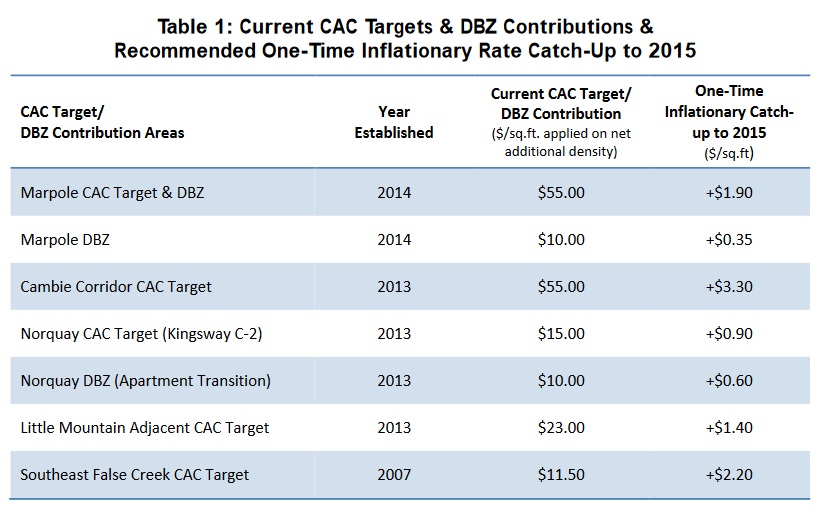
One of the major recommendations is that current CAC fixed target rates will now adjust annually with inflation, just as the current DCL rates do. The proposed inflation rate would be based on a third party index for property and construction costs and would change to reflect “market conditions”. Moreover, there will be a “One-time Inflationary Adjustment Catch-Up to 2015”, as the areas with fixed rates have not been adjusted for several years. Here is a table showing current and proposed new CAC target rates:

CAC Table

The report indicates that the City will minimize any potential negative impacts, either on the
development industry or on the City’s ability to adjust CAC targets and DBZ (Density Bonus Zone) contributions, by:
  • reviewing recommended adjustments with industry stakeholders before applying annual inflationary rate adjustments;
  • carrying out periodic updates to recalibrate CAC targets and DBZ contribution rates. The recalibration of rates would be established by updating the public benefit strategy growth costs and then testing development viability for appropriate growth cost recovery
  • monitoring the pace of rezoning and redevelopment activity in each CAC target and DBZ contribution areas.

2. Administrative Updates to City-wide CAC Policy

The report also identifies some changes to the current overall CAC policy, including:
Removing $3.00 per SF CAC target for Standard Rezonings, and the 1.35 FSR exemption on small site rezonings
The $3.00 per SF CAC rate had been in place since 1999, and had only been used 22 times in 17 years – half of those for office buildings. The City is now proposing to remove this target rate and use a negotiated CAC approach.
Clarifying that CAC payments are due prior to rezoning enactment
Previously, cash-in-lieu payment of CACs could be made at either rezoning enactment or building permit issuance. The new policy will now require payment at rezoning enactment only.
The full report can be viewed here: http://council.vancouver.ca/20160531/documents/p1.pdf

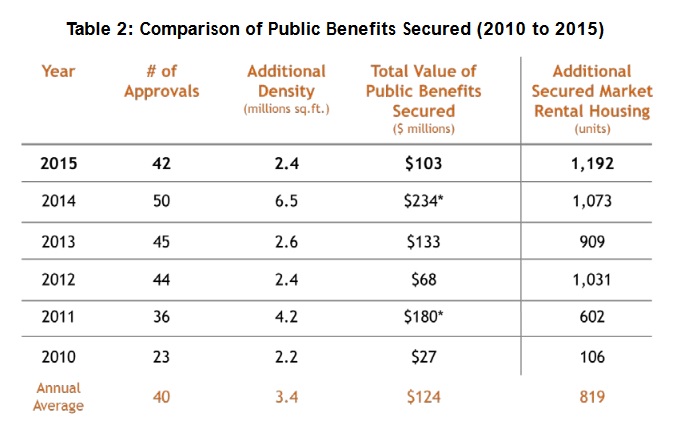
Coincidentally, Council will also receive the Annual Report on Community Amenity Contributions and Density Bonusing for 2015 (the report can be viewed here: http://council.vancouver.ca/20160531/documents/a1.pdf) . Here are a few highlights:
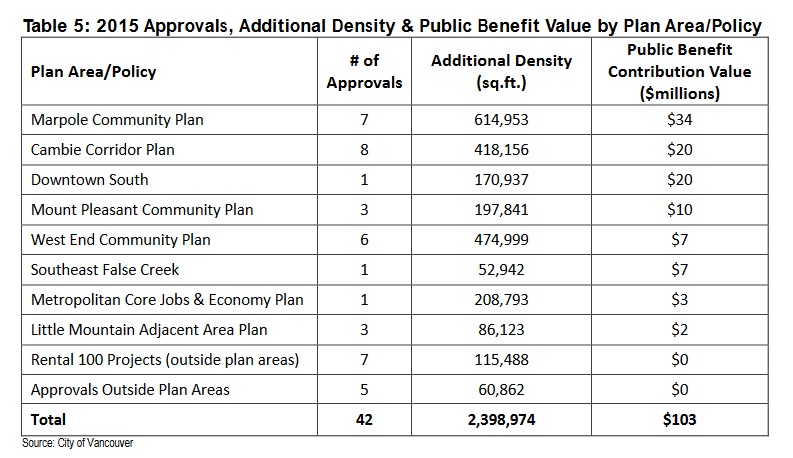
  • in 2015, there were 42 rezoning approvals resulting in 2.4 Million SF of additional density
  • these rezonings generated a total of $103 Million in CACs
  • by comparison, there were 1,600 building permits under existing zoningCAC Table_1
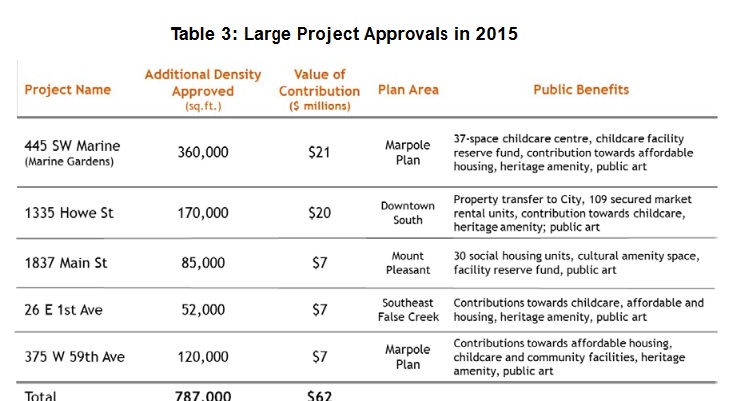
  • in 2015, five large projects accounted for 65% of all CACs:

CAC Table_2

  • Cambie Corridor, Marpole and West End accounted for over 50% of rezoning density and CACs

CAC Table_3

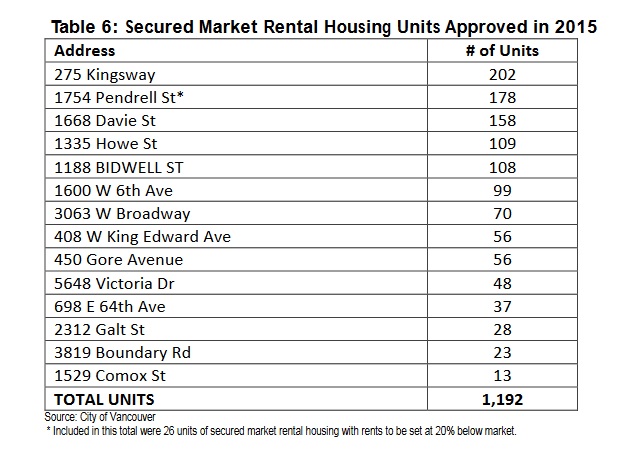
  • There were 14 secured market rental housing projects approved in 2015, representing 1,192 units

CAC Table_4

  • in 2015, applications for density transfers totaling 160,000 SF were approved, reducing the heritage density bank down to 650,000 SF.
  • Affordable housing was the largest recipient of public benefit contributions (56%), followed by childcare facilities (19%), heritage, community facilities, and parks/open space/public art.
May 26, 2016by david.taylor@colliers.com
Market Research

Market Spotlight: City of Vancouver Condo Resales

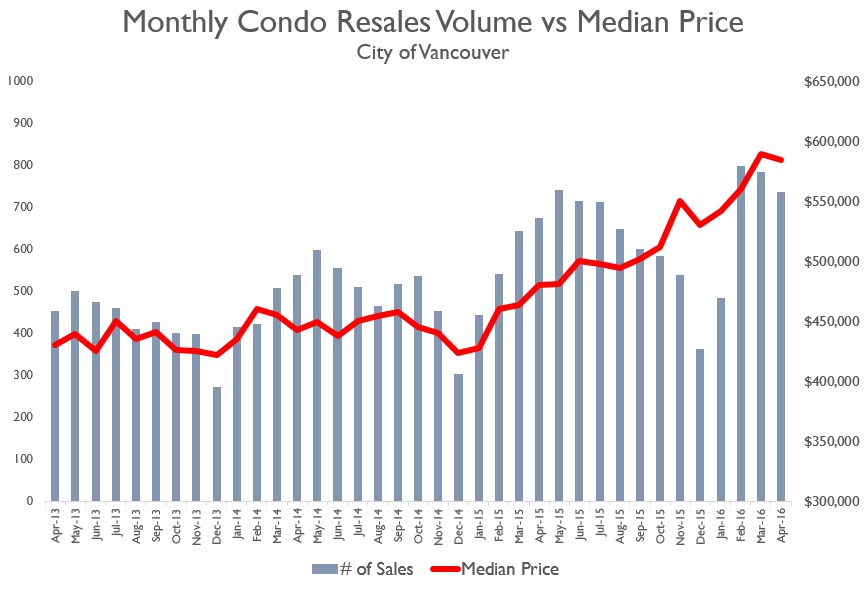
Here’s a look at resales data for condo unit resales in the City of Vancouver. Not only have the last few months shown record sales activity, pricing has risen noticeably, from the low $400k range in 2013, to just under $600k in the spring of 2016.

Resales Condos_May 2016Source: MLS Data

May 16, 2016by david.taylor@colliers.com
Market Research

Market Spotlight: Newer Condo Resales

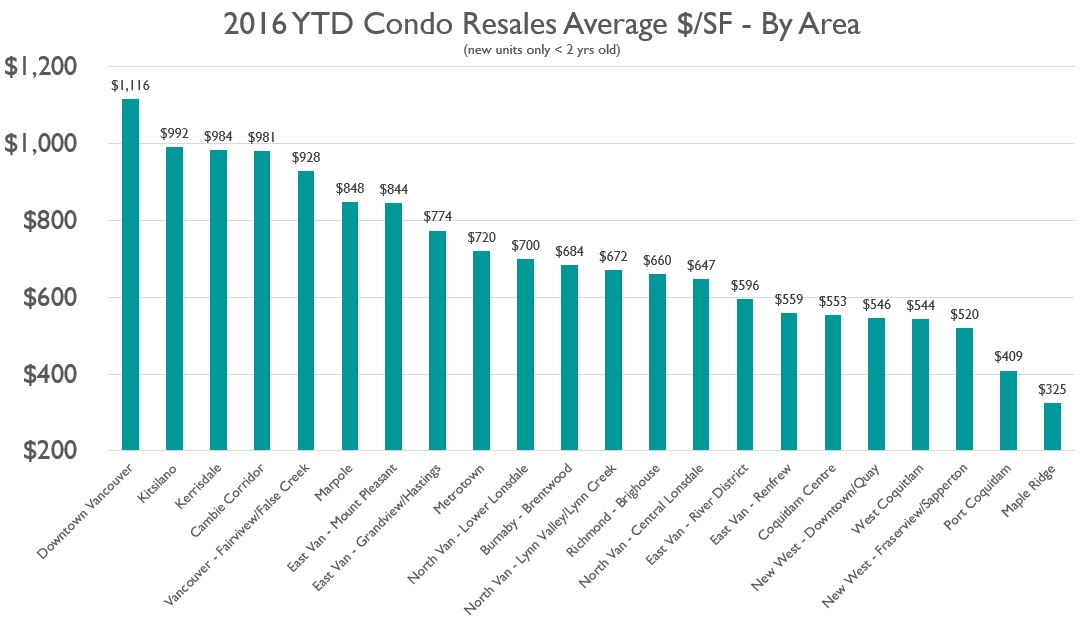
Here is a brief snapshot of the condo resales market since the start of 2016, shown as average price per SF broken down by sub-area/neighbourhood.

Condo Resales $ per SF_May 2016

Source: MLS Data

The above chart reflects data on all MLS sales for condo units that were one year old or newer at the time of sale, and only includes neighbourhoods with sales in multiple buildings. Pricing is slightly distorted by product type; for example, all of the downtown condo product is concrete highrise which is more expensive, whereas all of Maple Ridge product is in lowrise or townhouse form that is much cheaper to build and sell. Nevertheless, some may find the average pricing stats interesting.

The market for pre-sales inventory is likely to track above the average resales in a given sub-market.

May 3, 2016by david.taylor@colliers.com
Page 10 of 39« First...«9101112»2030...Last »

Thinking of selling?

I track every commercial sale in Metro Vancouver. If you're wondering what your property is worth, I can give you an informed view.

Get an Opinion of Value

David Taylor · Colliers · 604-761-7044

Search the Site

Categories

  • Apartment
  • Condo
  • Development
  • For Sale
  • Hotel
  • Investment
  • Land
  • Market Research
  • Office
  • Rental
  • Retail
  • SOLD


David Taylor Personal Real Estate Corporation

Colliers International

DT

David Taylor

Senior Vice President, Colliers Canada

David Taylor is a Senior Vice President at Colliers International in Vancouver, BC, specializing in the sale of commercial real estate across Metro Vancouver. He has sold over $1.7 Billion in office buildings, retail properties, apartment buildings and development land since 2004.

Vancouver Market chronicles investment and development activity in Metro Vancouver, including sale prices, cap rates, $/SF metrics, and market context for commercial real estate transactions.

© 2019 Copyright  |  All Rights Reserved