Vancouver Market - Chronicling Investment and Development Activity in Metro Vancouver
  • Home
  • Listings & Sales
  • About
  • Subscribe
Vancouver Market - Chronicling Investment and Development Activity in Metro Vancouver
Home
Listings & Sales
About
Subscribe
  • Home
  • Listings & Sales
  • About
  • Subscribe
Market Research

Market Spotlight: Downtown Condo Resales

Here’s a quick look at the recent uptick in resales values and activity for Downtown Vancouver condos, which have reported to have taken quite an upturn over the last few months after having been relatively flat over the past few years.

Here is data derived from all Downtown Vancouver condo resales from 2011 to April 2016. A couple of observations:

  • the average price YTD 2016 is $908 per SF (up from $761 for the same period 2015)
  • Average sold price/list price ratio 2016 YTD is 1.03

DT Condo Resales_Apr 2016 DT Condo Resales_Apr 2016_1
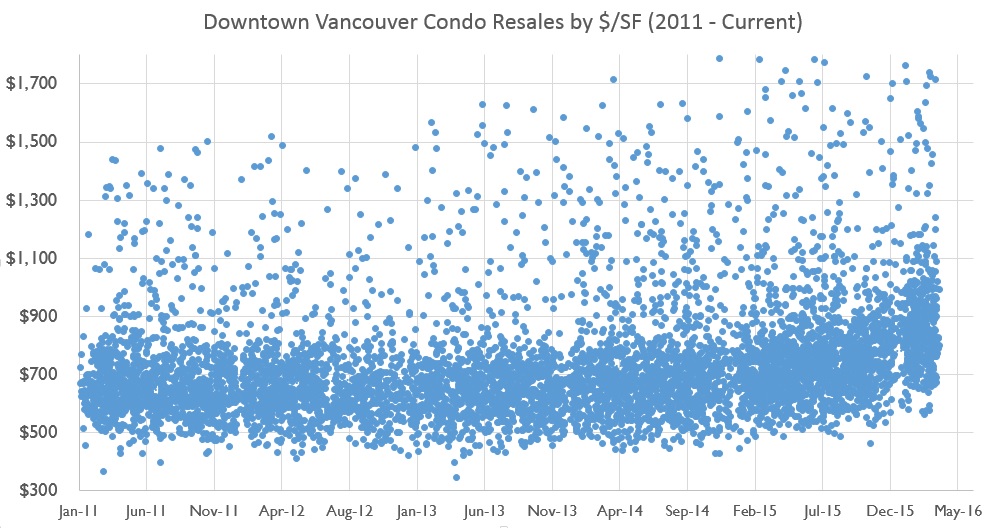
The above data contains all downtown Vancouver condo resales. For simplicity, all luxury  condo sales above $2,000 per SF were removed (approx. 40 sales).

Data source: MLS/REBGV data

April 4, 2016by david.taylor@colliers.com
Market Research

Market Spotlight: Downtown Land Values…60 Years Ago

Here is an interesting map from 1956 from the City of Vancouver Archives showing land value assessments by $/SF from 1954 assessments in Downtown Vancouver.

Granville Street was the prime area back then at over $24.00 per SF of land! Conversely, Coal Harbour and Yaletown were steals at less than $1.50 per SF. Of course, these areas were still primarily industrial areas and condos were simply an idea that wouldn’t take hold for another decade. Fast forward sixty years and land values in those ‘hoods have increased approximately 2000%.

(click on the map for a zoomed in view)

Value of land (1954 assessment)
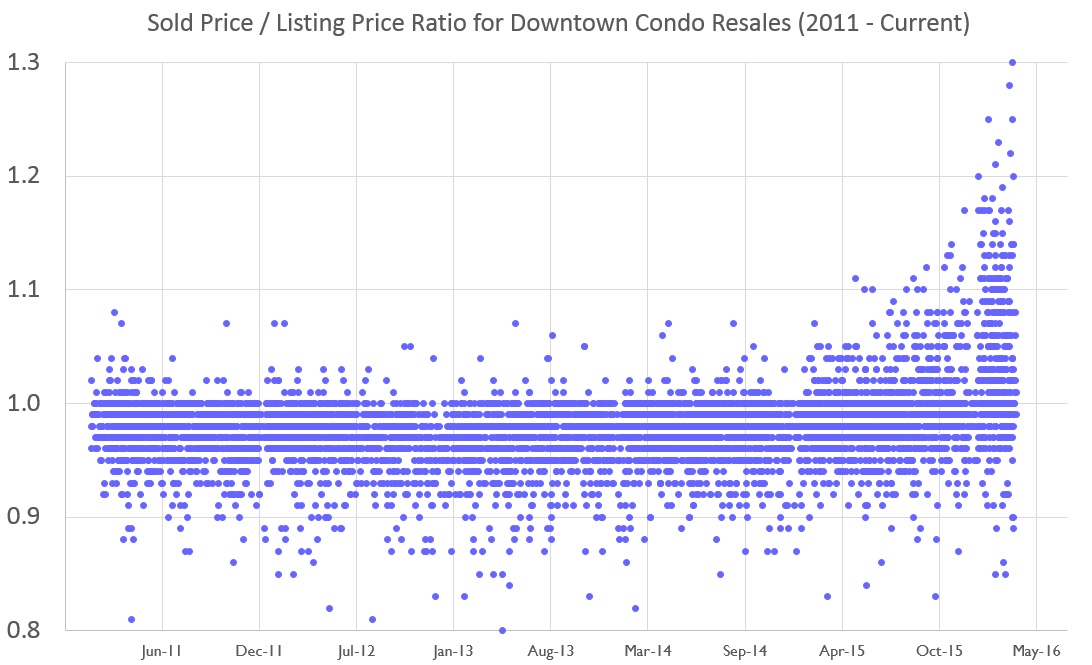
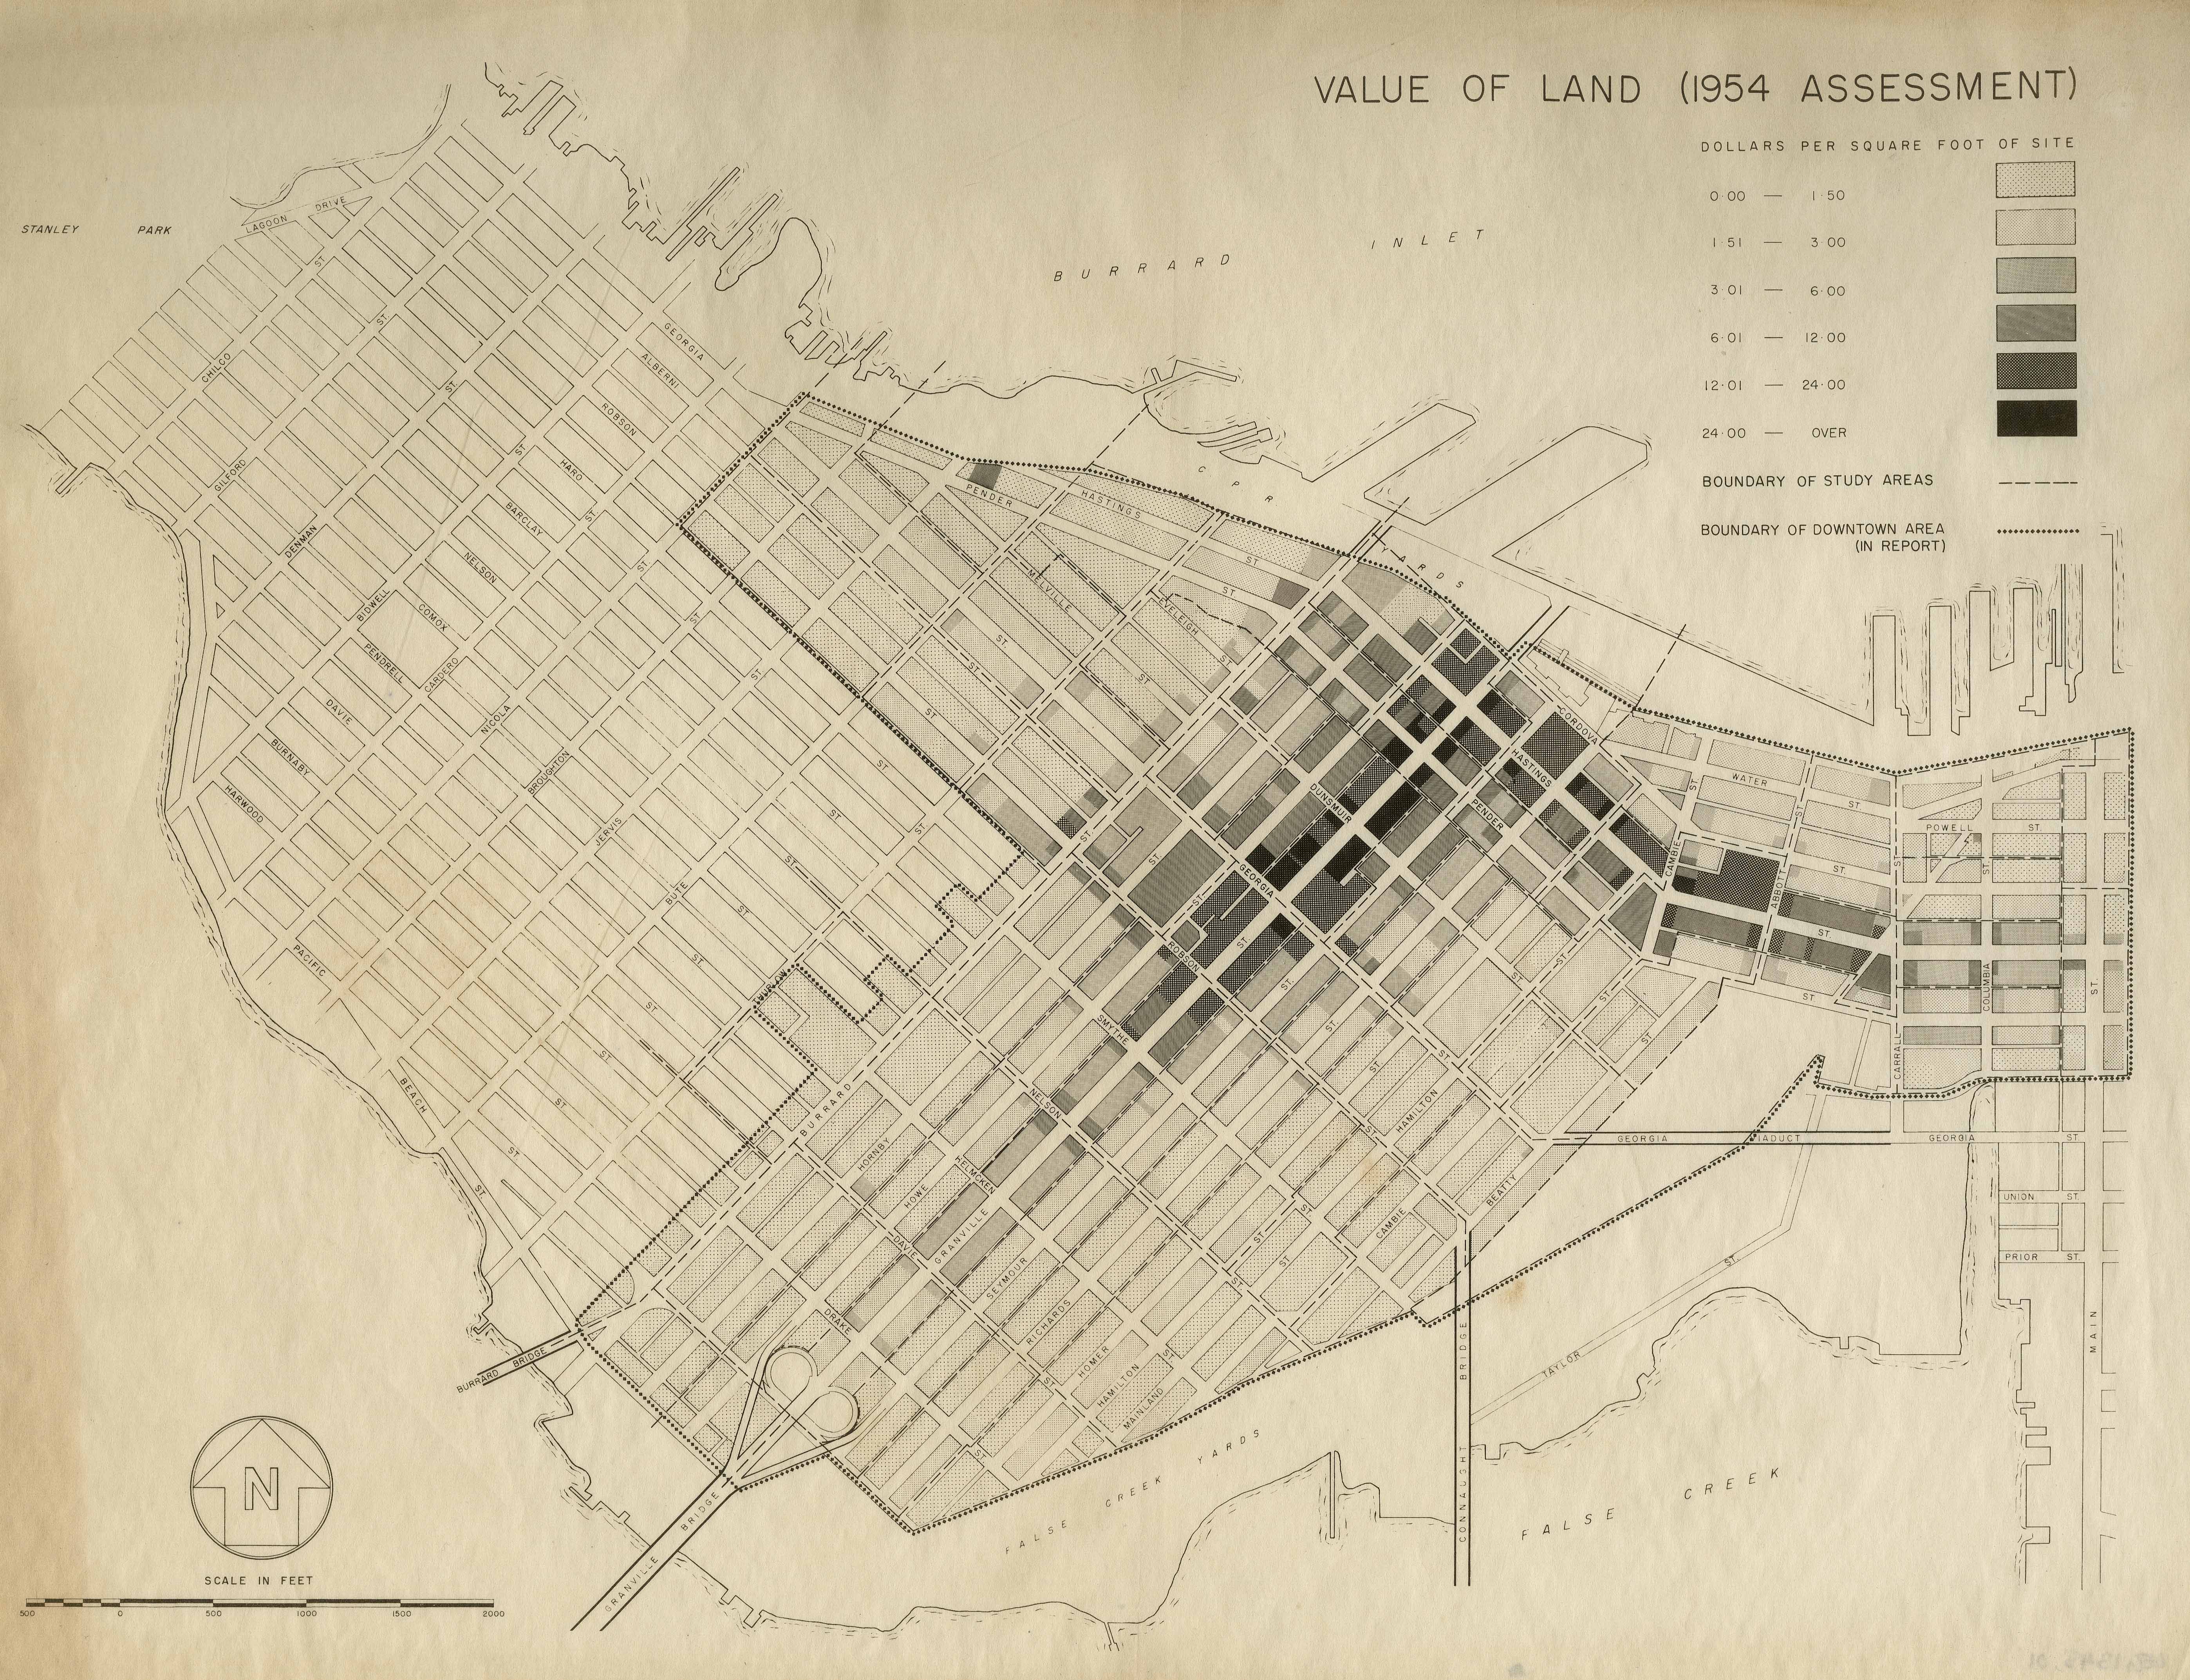
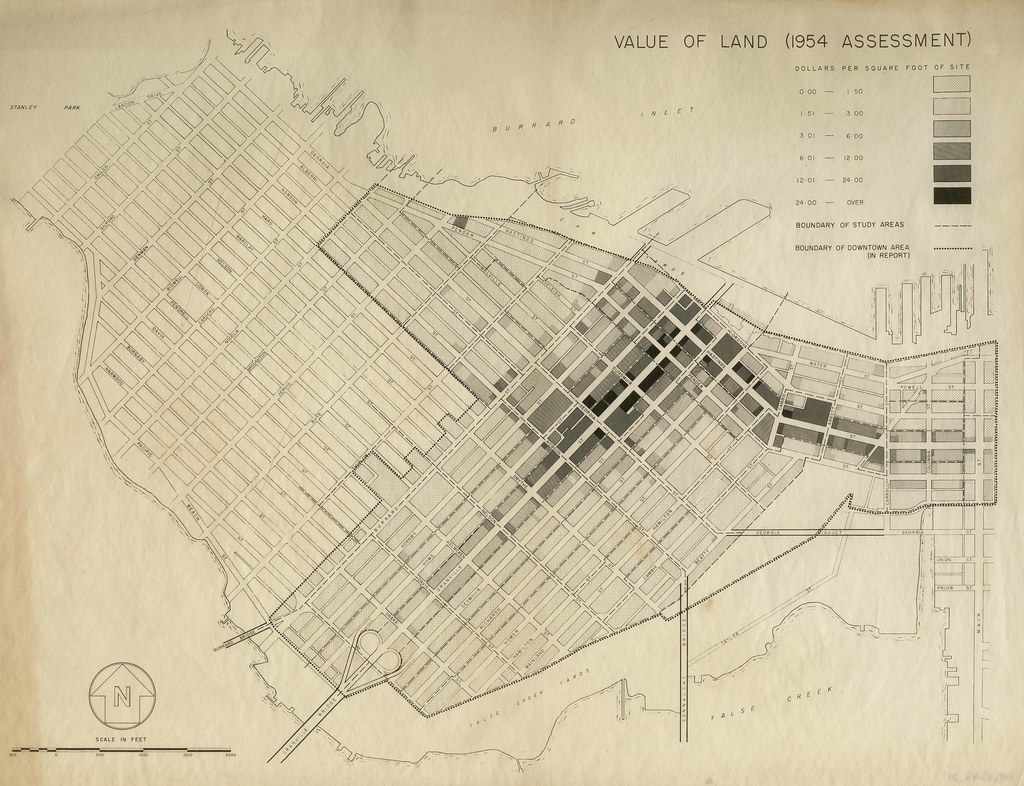
“Scope and content Item is a map showing land values in dollars per square foot for the downtown area bounded by Burrard Street, Robson Street, and Nicola Street in the west and Main Street in the east.”

April 1, 2016by david.taylor@colliers.com
Development, Market Research

How Burnaby is Building More Highrises than Vancouver (…Way More)

While the City of Vancouver grapples with worsening housing affordability conditions, increasingly contentious area plans, and an excruciatingly slow planning process for even modest density increases, Burnaby is quietly going through what is likely one of the most dramatic suburban transformations in the history Metro Vancouver, if not Canada.

Most people have only really begun to take notice more recently with higher and higher towers starting to pop up in Metrotown and now Brentwood. With a strong condo market fuelling demand for new towers near transit, most of Vancouver’s large developers have been active securing sites in Burnaby in the last several years. While the rezoning applications tend not to attract as much attention as those high profile projects in Downtown Vancouver, the magnitude of activity can’t be ignored, particularly when one ponders the scale of projects like Shape Properties’ recently approved Lougheed Town Centre.

How did Burnaby become a hotbed of highrise construction at a scale that dwarfs even the City of Vancouver? You have to go back a few years to understand how the plans were put in place.

The City of Burnaby put plans in place several years ago to concentrate growth in and near major rapid transit (Skytrain) nodes, particularly in four town centre areas they identified as follows:

  • Metrotown
  • Brentwood
  • Lougheed
  • Edmonds

Furtheremore, unlike homeowners in Vancouver that have been increasingly vocal against even midrise developments, towers in Burnaby have faced less public opposition during rezoning, in part due to the fact that many highrises are being being built in former industrial areas that are being lost to residential, or in areas that are primarily occupied by older rundown apartments where tenants have, seemingly, less influence with the City than single family homeowners.

So far, about 30 highrise towers have been built in these four town centre areas (including 2 office towers), primarily in Metrotown, where projects such as Sovereign by Bosa – a 45-storey hotel and condo tower, and Metroplace by Intracorp – a condo tower near the Metrotown Skytrain station, have each taken advantage of sizeable density increases per the Metrotown Town Centre plan. The sales velocity and pricing of each new development spurs even greater interest for new projects and generates more and more rezoning applications. Land speculation is now commonplace, particularly in more mature areas such as Metrotown.

The City of Burnaby’s willingness to allow fairly substantial density on previously underutilized parcels of land previously dedicated to commercial and industrial use has vaulted Burnaby far ahead of any area in Metro Vancouver in terms of highrise construction. Shape Properties’ two mall sites: Brentwood and Lougheed, are the largest and most well known, but others such as Onni’s Gilmore Station (rumored to include BC’s new tallest tower) and Concord’s Brentwood projects are massive themselves and in terms of height and scale, tower over Vancouver’s most ambitious plans such as the recently scaled back Oakridge.

A review of current and forthcoming developments in the City of Burnaby shows over 100 highrises in various stages of development (under application or construction), almost all of them intended for residential condos, with a handful of commercial office towers usually required on the larger scale developments to preserve job space. A few stats show the scale of this wave of development in Burnaby:

  • 106 highrises under development (compared to 68 in the City of Van)
  • 47 highrises of 40-storeys or more (compared 13 in the City of Van)
  • Over 30,000 units under development (excluding lowrise and townhouse units)

Here is a breakdown of all of this activity, by each area of Burnaby:

[table id=20 /]

[table id=21 /]

[table id=22 /]

[table id=23 /]

The above floor & unit counts are best estimates unless otherwise confirmed in City of Burnaby planning/rezoning application documents.

It is anticipated that there will be more rezoning applications forthcoming in the near future, particularly as the Town Centre Plans are further refined; however, it can be argued that the majority of the most central and logical development sites have now been secured by developers. With a very active presales market and continued upward trajectory of condo prices, it can be anticipated that land costs will continue to increase for these Burnaby tower sites in the future, with areas such as Port Moody and Coquitlam seeking to catch some of the spillover of this growth in conjunction with the 2017 completion of the Evergreen Line.

With the height and scale of these projects in Burnaby, it will be interesting to see what, if any response the City of Vancouver has while it struggles to create even modest height and density in increasingly expensive and largely unaffordable areas.

For the record, I am not espousing the virtues of density as the primary means of increasing affordability. In fact, if Burnaby is behind in an area, it is in the creation of new rental units for which there is currently no coherent or substantive policy. This, in part, has helped the viability of several projects since rental replacement is not a requirement like it is in other municipalities. The City of Vancouver has been more proactive in the provision of affordable housing which has hopefully had at least a moderate impact in terms of affordability.

March 18, 2016by david.taylor@colliers.com
Development, Market Research

Market Spotlight: District of North Van Development Activity

The District of North Vancouver held a council workshop earlier this week during which an update was provided on development activity in the five town centre and village centre areas.

While rezoning applications do exist outside the town centre and village centre areas, the District of North Van has sought to concentrate development growth in these areas.

A summary of this update is provided below:

Lions Gate Village

DNV Feb 2016 Edgemont Village

DNV Feb 2016_1

Lynn Valley Town Centre

DNV Feb 2016_2Lynn Creek (formerly Lower Lynn)

DNV Feb 2016_3Maplewood

DNV Feb 2016_4

February 3, 2016by david.taylor@colliers.com
Development, Market Research

District of North Van Updates CAC Policy

The District of North Vancouver will review a report at council next week that seeks to update the District’s Community Amenity Policy, which has not been reviewed since 2010. The update was required due to increased development pressures and was brought forward partially at the encouragement of the development community. Coriolis Consulting assisted with the review of existing policy.

Here is an excerpt regarding the existing policy:

EXISTING POLICY:

The District of North Vancouver’s existing CAC policy includes two different approaches to
determine the appropriate value of a CAC, depending on the location of the rezoning:

  • In the designated Town and Village Centres (growth centres), the value of the CAC is
    determined through a negotiated approach, equivalent to 75% of the estimated increase in the market value of the property due to the rezoning. The reference to 75% of the increase in property value is to ensure that the CAC does not exceed the
    amount that is financially viable for the development project.
  • Outside the Centres, the CAC value is based on a target fixed rate per square foot of additional residential floorspace approved by the rezoning. Outside of centres, the CAC can be negotiated if the developer thinks the fixed rate is not appropriate or the rezoning exceeds the density identified in the OCP.

Below is an excerpt outlining the recommended changes to be implemented going forward:

“Recommended CAC Approach Outside Centres:

Staffs recommended approach to CACs outside of the Centres is:

1. Establish three separate fixed rate CAC categories outside the Centres with fixed rate
targets as follows:

(a) $6 per square foot (current rate $5) of increased permitted residential gross floor  area for any project with an FSR less than or equal to 0.8 FSR;
(b) $13 per square foot (current rate $5) of increased permitted residential gross floor area for any project with an FSR greater than 0.8 but less than or equal to 1.0 FSR
(c) $20 per square foot (current rate $15) of increased permitted residential gross floor area for any project with an FSR greater than 1.0

2. Negotiate the CAC for the rezoning of any properties that are currently improved with rental housing to take into account the specific details of any rental replacement requirement. The target for negotiations should be at most 75% of the increased value due to the rezoning .

3. Continue to allow negotiated CACs in the specific circumstances currently identified in the District’s policy, but change the target negotiated CAC to be a maximum of 75% of the increased value due to the rezoning, rather than “50% to 75%” of the increased value due to the rezoning as currently written.

Recommended CAC Approach Inside Centres:

Staff’s recommended approach to CACs in the Centres is:

1. Negotiate CACs for major, complex rezonings where it is difficult to determine an appropriate CAC rate in advance of a development application, including:

  • Large sites that have significant land dedications and on-site infrastructure requirements.
  • Sites which include existing rental housing that the District would like to see replaced as part of any redevelopment.
  • Higher density mixed-use sites, such sites in the CRMU 2 and CRMU 3 OCP designations (i.e., mixed-use projects over 1.75 FSR).
  • Highrise residential projects (over 6-storeys in the RES Level 6 designation).
  • Sites identified for a significant on-site amenity.
  • Sites currently zoned for industrial use.
  • Applications that require an OCP amendment.

The target for negotiations should be a maximum of 75% of the increased property value due to the rezoning.

2. Establish new fixed rate area inside the five Centres with a fixed rate target of $20 per square foot (presently negotiated) of additional permitted residential floorspace. The fixed rate areas for inside centres may be found in Schedule 2 of the Draft CAC Policy attached to this report.”

Source: http://app.dnv.org/OpenDocument/Default.aspx?docNum=2796413

January 15, 2016by david.taylor@colliers.com
Page 11 of 38« First...«10111213»2030...Last »

Search the Site

Vancouver Market Follow

David Taylor - Senior Vice President @ColliersCanada. Chronicling investment and development activity in Vancouver. Views are my own.

vancouvermrkt
vancouvermrkt Vancouver Market @vancouvermrkt ·
22 Feb

SOLD: East Vancouver Retail & Apartment Building
https://vancouvermarket.ca/2026/02/22/sold-east-vancouver-retail-apartment-building/

Reply on Twitter 2025687868316975176 Retweet on Twitter 2025687868316975176 Like on Twitter 2025687868316975176 1 X 2025687868316975176
Retweet on Twitter Vancouver Market Retweeted
northshorenews North Shore News @northshorenews ·
17 Feb

12-unit Gleneagles townhouse project proposed in West Vancouver

Reply on Twitter 2023587010053886050 Retweet on Twitter 2023587010053886050 1 Like on Twitter 2023587010053886050 2 X 2023587010053886050
vancouvermrkt Vancouver Market @vancouvermrkt ·
31 Jan

A new proposal has surfaced for the parking lot next to Waterfront Station.

The redesigned project includes a 26-storey, 416,000 SF office tower, shaped like a tree, cantilevered over the existing station building.

Architect: James Cheng

Details: https://bit.ly/46aUB0W

4

Reply on Twitter 2017391670359142680 Retweet on Twitter 2017391670359142680 Like on Twitter 2017391670359142680 3 X 2017391670359142680
vancouvermrkt Vancouver Market @vancouvermrkt ·
23 Jan

Reply on Twitter 2014742407959740885 Retweet on Twitter 2014742407959740885 Like on Twitter 2014742407959740885 8 X 2014742407959740885
Load More

Categories

  • Apartment
  • Condo
  • Development
  • For Sale
  • Hotel
  • Investment
  • Land
  • Market Research
  • Office
  • Rental
  • Retail


David Taylor Personal Real Estate Corporation

Colliers International

© 2019 Copyright  |  All Rights Reserved