There are many significant challenges facing housing affordability in the City of Vancouver. Two of the primary challenges are directly linked to the private market’s inability to build new rental housing. The lack of land available for new rental construction, and the difficulties achieving density sufficient to warrant its construction on most sites are constantly cited by the development community as barriers to new supply.
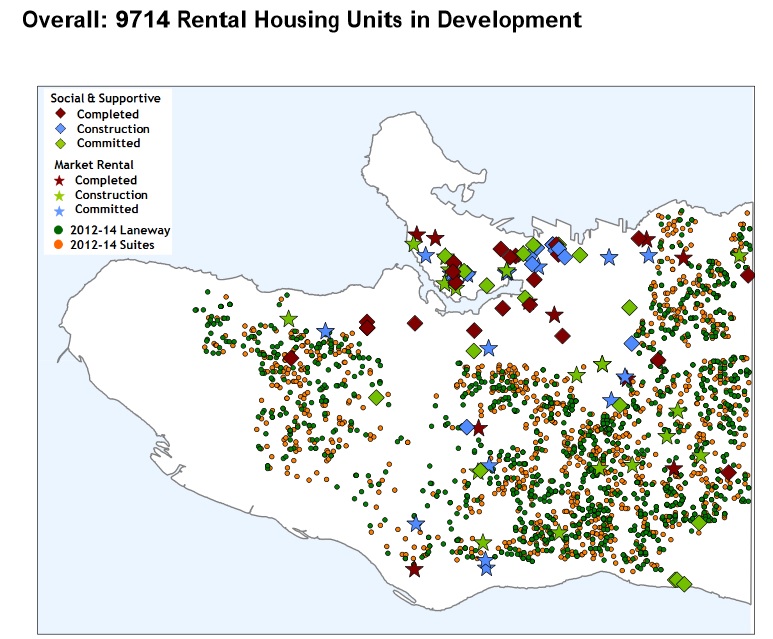
The City’s existing policies that have sought to incentivize new rental construction include Rental 100. While Rental 100 and its predecessor STIR have been successful in generating almost 4,000 unit approvals (only a few hundred have been built so far), the policy is not without controversy given that it allows what would otherwise be considered spot rezonings were they market condo projects. The City’s recent decision to set limits on rents for new rental projects as a means of promoting “affordability” will only impede the viability of those projects seeking approval under Rental 100.
What about the existing apartment zones?
65% of the City of Vancouver’s land base is dedicated to the lowest form of housing density: single family housing. The remaining 35% is divided among an ever-shrinking base of commercial, industrial, institutional and multi-family. Apartment vacancy rates have hovered below 1% for most of the last decade. In a market where homeownership is increasingly out of reach, it’s time to focus on building more rental where it is already approved, where services and amenities already exist, and most importantly, where renters want to be…RM zones.
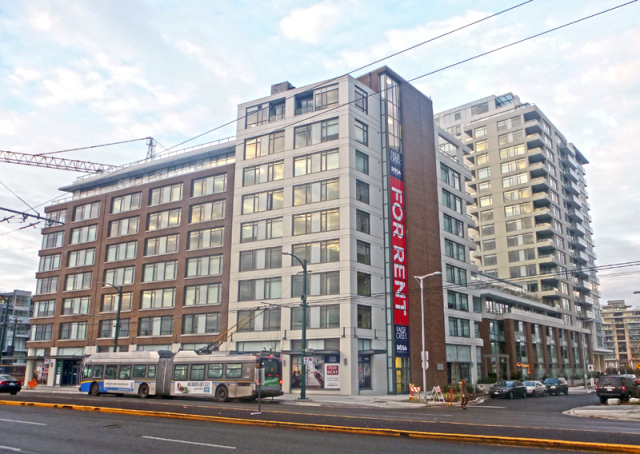
With almost 3,000 apartment properties in the City of Vancouver, the vast majority are 3 or 4-storey walkups that were built in the 1950’s and 1960’s. Back then, the City Vancouver’s population was only climbing above 300,000 for the first time and relatively speaking, opportunities to buy land and build an apartment building were relatively plentiful.
Today, these apartments and the zoning that was put in place to permit them, are no longer responsive to the challenges facing today’s housing market.
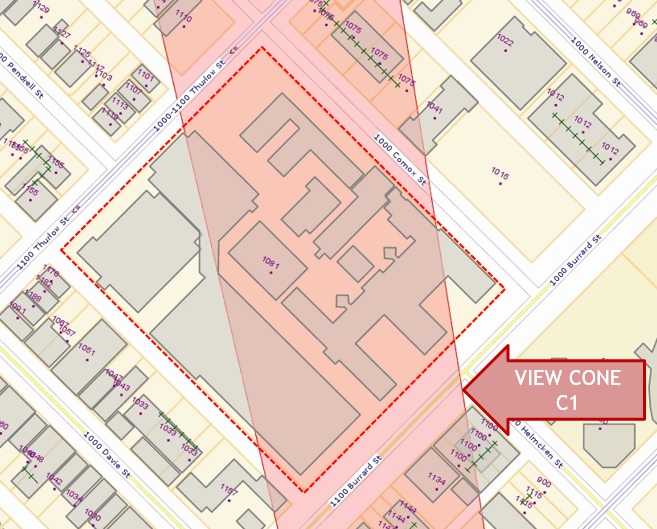
Let’s focus on specific zones for a moment. The various multi-family zoning types that are scattered throughout the City are tailored primarily toward fairly low density walkup apartment properties. These zones include RM-3, RM-3A, RM-4, RM-4N. These zones generally allow for 1.45 FSR density, basically double that of single family, or about half that of a typical condo development. While these zones and the attendant setbacks, heights and parking were appropriate when they were built, are they appropriate in 2015?
So where are these zones located? They are primarily in established apartment areas such as Kitsilano, Kerrisdale, Marpole, Fairview, Mount Pleasant and Grandview Woodlands. For the purposes of this analysis we have intentionally excluded the already dense West End which is primarily higher density RM-5 zoning.
The City of Vancouver has been loathe to tinker existing apartment zones for many years, particularly as a result of a worrisome trend to convert rental apartments to condos in the 1990’s and early 2000’s, a trend which effectively ceased following the City’s indefinite moratorium on condo conversions for any property containing six units or more (the “rate of change” policy). Certainly these efforts to protect the existing rental stock have protected thousands of tenants that are currently paying far below market rents in central locations.
Currently, City of Vancouver policies prevent building owners or developers from tearing down or doing widespread renovations to existing apartment stock. Condo conversions are understandably deemed to run contrary to the City’s efforts on housing affordability, and so-called “renovictions” are highly publicized in the media as flaunting with tenants’ basic rights.
What is lost in the conversation however, is that the vast majority of buildings in these zones are very old, inefficient lowrise, low-density apartment buildings that no longer meet the needs of the current population.
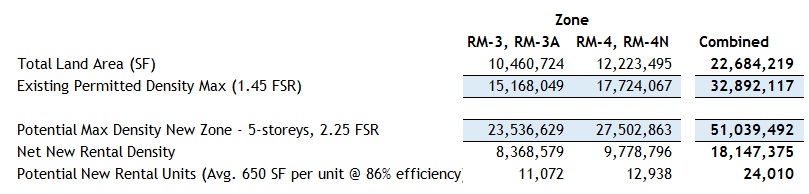
Some facts regarding the RM-3, RM-3A, RM-4 & RM-4N zones:
- Total number of Apartment Properties*: 2,011
- Total land occupied: 22,684,219 SF, or 521 acres
*RM-3 and RM-4 zones only, assessed value >$1M
According to CMHC’s 2014 rental market report, there are currently 35,113 private rental apartment units (excluding condos) that are located outside of the Downtown and West End. In a City starved of land and choking on housing affordability, it still shocks me that there are more single family lots (47,000) then there are apartments.
Many of these apartments have been owned for many decades by owners that are unwilling to sell due to capital gains. Likewise they have typically not spent money to upgrade or improve their buildings due to the inability (in most cases) to raise rents substantially to justify the capital cost.
The building forms of the mid-twentieth century are not always relevant any longer. In many cases these buildings have generous setbacks, no balconies, more than one parking stall per unit.
Potential Solution? Densify Existing Rental Apartment Zones For Rental Only
A cursory analysis of the above-mentioned RM-3 and RM-4 zones suggests that with even a moderate density increase to 2.25 FSR (or a 4-5 storey building form), would yield the following:
>18,147,000 SF of new density, or about 24,000 rental apartment units (six times more than what the City has generated since 2008 through STIR and Rental 100)
> If only 1% of the apartment stock (20 buildings) file applications per year, that is 240 units per year of additional rental housing, or an increase in the stock of about 1%
Implementation of such a drastic planning policy would obviously create a number of potential issues. Some other thoughts for consideration:
> Protection of existing tenants: The only way densification can work is if existing renters and apartment neighbourhoods support the policies that will be required to facilitate it. Existing tenants in affected buildings could be offered unchanged rents in the new or renovated buildings with an option for a buy-out to be offered if the tenant moves on. This could be regulated by the City.
> Rent Maximums: Ensure that only new tenants can be charged market rents, existing tenants that wish to stay are allowed to do so at their previous rent level. In many cases, the additional density will more than offset these rents.
> Continue to Prohibit Mixed Condo/Rental: As was learned by STIR (which allowed rental as a public incentive), mixing market condos and rentals creates many challenges
> Temporary Capital Gains Waiver: one of the largest impediments to any apartment building owner in selling their buildings is their capital gains exposure. If the Federal Government is serious about assisting Vancouver’s worsening housing affordability problems, why not provide this kind of incentive to apartment owners by relaxing capital gains if a building owner increases their rental density? Will some wealthy landlords benefit? Of course. But the real benefactor will be the tenants of the City of Vancouver with an increased supply where it is needed. in the absence of direct federal tax credits or direct investment from senior levels of government, opportunities for new rental will continue to decline.
Without sufficient incentives or areas to build, new rental apartment construction will continue to be a challenge and invariably housing affordability will suffer. The above is only for discussion purposes and is not presented to be the solution, but hopefully a piece of the conversation…